Services Health Report
Irrespective of whether a service is a web site or not, a user may want to view the resource usage (e.g., CPU, memory, disk utilization) and other key metrics about all the servers that support a specific service. The Services Health report addresses this requirement. From this report, a user only sees all the components that are specific to a chosen service, and can review performance metrics across all these components to identify any bottlenecks in the infrastructure.
Figure 1 shows a Services Health report.
Assume a case, where the users accessing a specific service experience slow responsiveness and increase in number of failed web transactions. In order to find out how well the service is performing, you need to have the reports that will highlight the resource utilization and other key metrics about the servers that support this service.
In order to generate this report, do the following:
-
Select the Services Health option from the Analytical Reports node of the REPORTS BY FUNCTION tree.
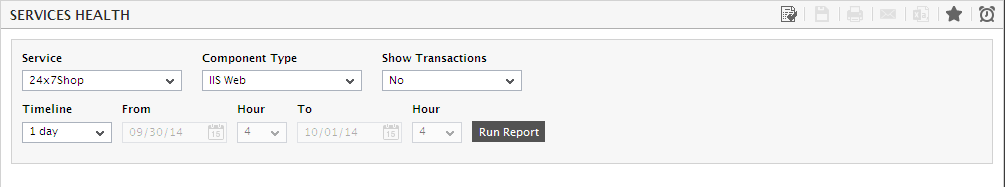
- Select the Service for which the report is to be generated from Figure 1.
- Upon selecting the Service to be monitored, select the Component Type. All the component types associated with the selected service will be made available for you to choose from. For our example, we will select the IIS web server component-type in the service and review its performance across the service.
- Next, indicate whether the report should Show Transactions or not. The Show Transactions flag appears only if the Service chosen is a web site service. If the Show Transactions flag is switched on, then the resulting Services Health report will also provide insights into the performance of the transactions to the selected web site. On the other hand, switching off the Show Transactions flag will result in a report that provides useful information on general web site and web server performance, and no information that is transaction-specific.
-
Specify a Timeline for the report.
Note:
For every user registered with the eG Enterprise system, the administrator can indicate the maximum timeline for which that user can generate a report. Once the maximum timeline is set for a user, then, whenever that user logs into eG Reporter and attempts to generate a report, the Timeline list box in the report page will display options according to the maximum timeline setting of that user. For instance, if a user can generate a report for a maximum period of 3 days only, then 3 days will be the highest option displayed in the Timeline list - i.e., 3 days will be the last option in the fixed Timeline list. Similarly, if the user chooses the Any option from the Timeline list and proceeds to provide a start date and end date for report generation using the From and To specifications, eG Enterprise will first check if the user's Timeline specification conforms to his/her maximum timeline setting. If not, report generation will fail. For instance, for a user who is allowed to generate reports spanning over a maximum period of 3 days only, the difference between the From and To dates should never be over 3 days. If it is, then, upon clicking the Run Report button a message box will appear, prompting the user to change the From and To specification.
-
In addition to the settings discussed above, this report comes with a set of default specifications. These settings are hidden by default. If you do not want to disturb these default settings, then you can proceed to generate the report by clicking the Run Report button soon after you pick a Component Type. However, if you want to view and then alter these settings (if required), click on the
 button. The default settings will then appear in the MORE OPTIONS drop down window (see Figure 2). The steps below discuss each of these settings and how they can be customized.
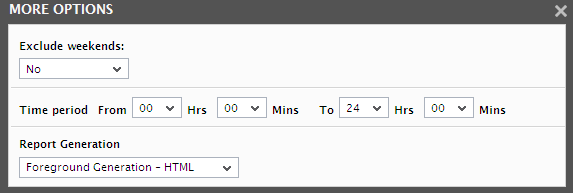
Figure 2 : The default settings for generating the Services health report
- Specify the start time and end time for report generation against the Time period field (see Figure 2).
-
If the timeline specified for the report needs to exclude the data collected during the Weekends, then set Exclude weekends to Yes. If not, select No.
Note:
The Weekend settings for a Consolidated Zone report will apply to this report too.
-
In large environments, reports generated using months of data can take a long time to complete. Administrators now have the option of generating reports on-line or in the background. When a report is scheduled for background generation, administrators can proceed with their other monitoring, diagnosis, and reporting tasks, while the eG manager is processing the report. This saves the administrator valuable time. To schedule background processing of a report, you can either select the Background Save - PDF option or the Background Save - CSV option from the Report Generation list. In this case, a Report Name text box will appear, where you would have to provide the name with which the report is to be saved in the background. To process reports in the foreground, select the Foreground Generation - HTML option from this list.
Note:
- The Report Generation list will appear only if the EnableBackgroundReport flag in the [BACKGROUND_PROCESS] section of the eg_report.ini file (in the [EG_INSTALL_DIR]\manager\config directory) is set to Yes.
- The default selection in the Report Generation list will change according to the Timeline specified for the report. If the Timeline set is greater than or equal to the number of days specified against the MinDurationForReport parameter in the [BACKGROUND_PROCESS] section of the eg_report.ini file, then the default selection in the Report Generation list will be Background Save - PDF. On the other hand, if the Timeline set for the report is lesser than the value of the MinDurationForReport parameter, then the default selection in the Report Generation list will be Foreground. This is because, the MinDurationForReport setting governs when reports are to be processed in the background. By default, this parameter is set to 2 weeks - this indicates that by default, reports with a timeline of 2 weeks and above will be processed in the background.
- Finally, click the Run Report button to generate the report.
-
Figure 3 depicts the Services Health report for the IIS web servers involved in the delivery of a web site service. Since the Show Transactions flag has been enabled in our example, you can see that a site-level and individual web server-level summary on transaction health is included in the report. By default, all transaction-related metrics such as Request_rate, Pct_errors, Pct_aborts, etc., appear in these sections. Below the transaction-centric sections, you will find two more sections, the first of which summarizes the overall health of the chosen Component Type, and the second providing valuable information on the performance of each component of that type. In our example, we have shown the overall Health% of an Active Directory Server, which stands at 100%.
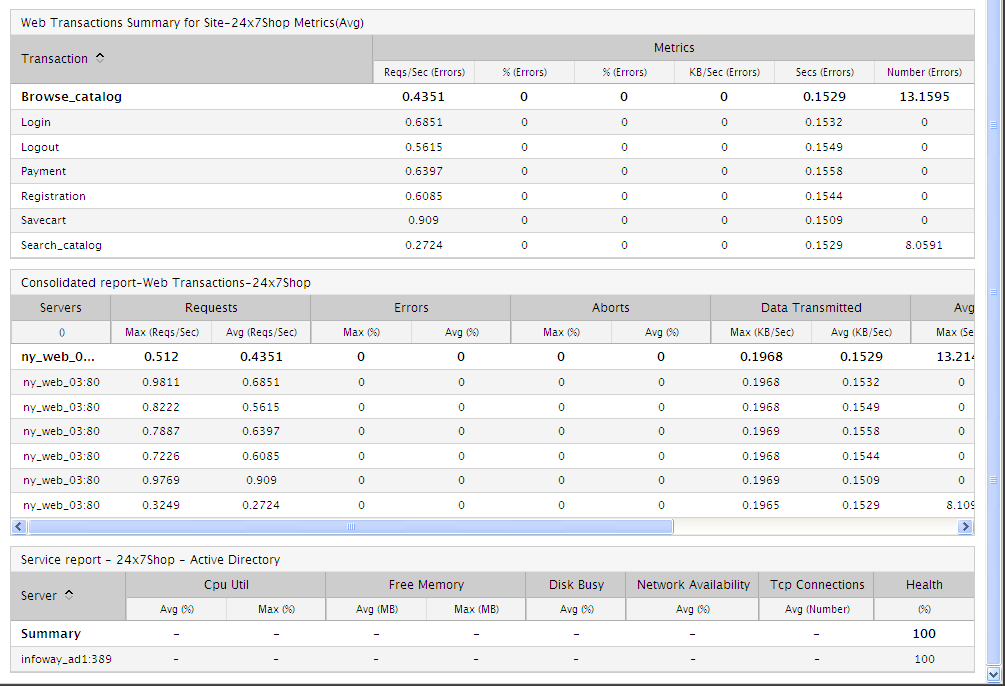
Figure 3 : The Service Health report with 'Show Transactions' on
Note:
As stated earlier, by default, all transaction-related metrics find a place in the transaction-specific sections of Figure 3. As for the remaining sections, the following measure configurations apply:
- Default measure configurations for the Consolidated Zone Report
- Configurations specific to the chosen Component Type for the Consolidated Zone Report
-
A default set of measures pre-configured for the Services report in the [SERVICES_REPORT] section of the eg_report.ini file (in the <eg_install_dir>\manager\config directory); these default measures are Request rate, Pct errors, Data transmission rate, and Data received rate. You can, if you so desire, add more default measures to the [services_report] section in the format: Default:<InternalTest>:<InternalMeasure>#<DisplayName>=<Comma-separated list of functions>. To determine the internal test and measure names, use the procedure explained in Page First, determine the Internal name of the test and measure to be configured. For that, do the following: of this manual.
For instance, if you want the report to display the number of current requests handled by a web site, then your specification would be:
Default:WebSiteTest:Num_current_requests#Num_current_requests (Num)=Avg,Max
- Similarly, you can also remove one/more default measures or modify them.
-
If the Show Transactions flag had been disabled, then the web transaction related measures will not be available in the report (see Figure 4).
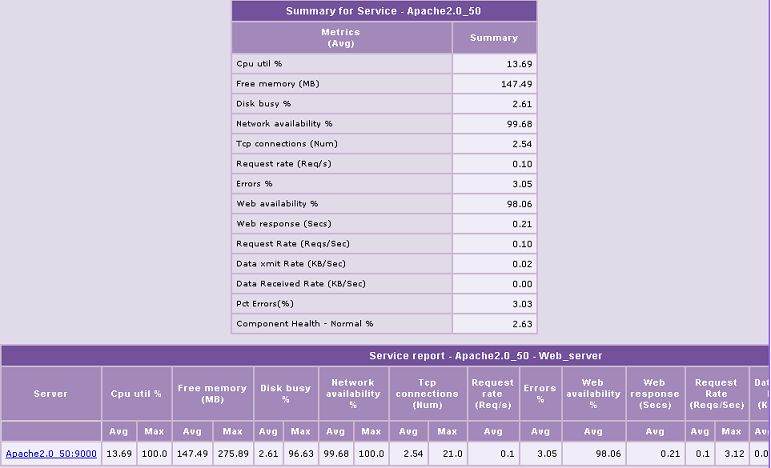
Figure 4 : The ServicesHealth report without the Show Transactions flag
-
In order to zoom into the performance of a particular component of the chosen type, click on the Server link in the second section of Figure 3. A Server Report shedding light on the performance of the Apache web server in our example then appears (see Figure 5).
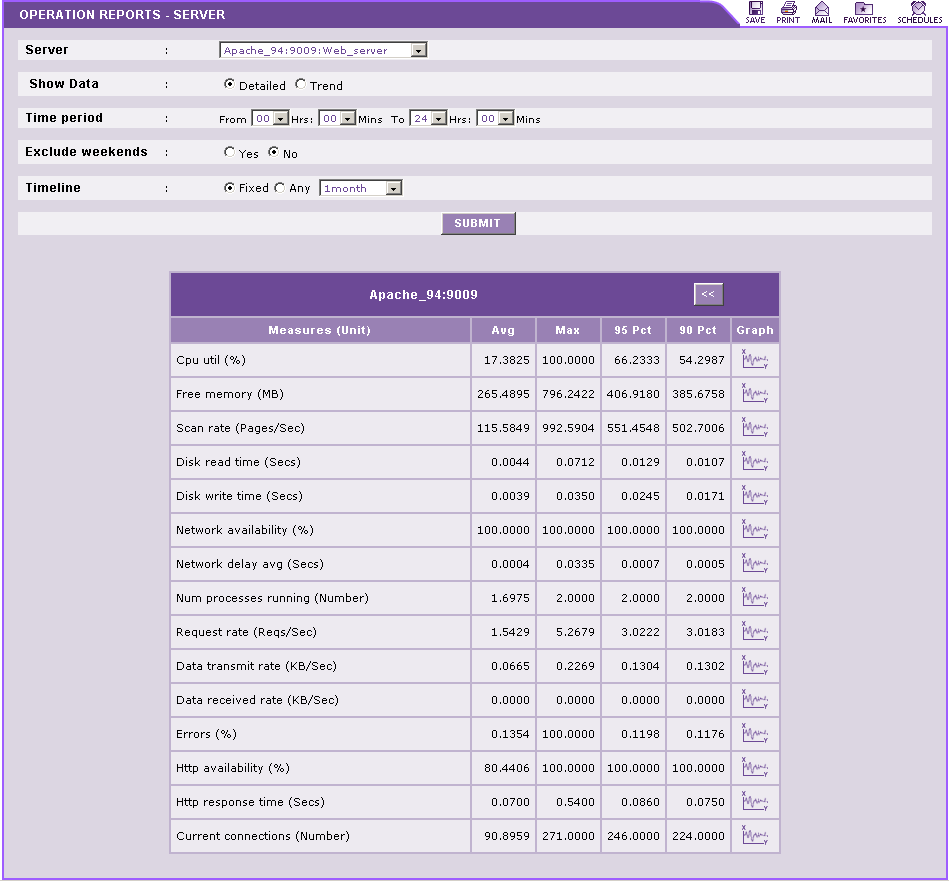
Figure 5 : The individual component’s performance for the IIS webserver
-
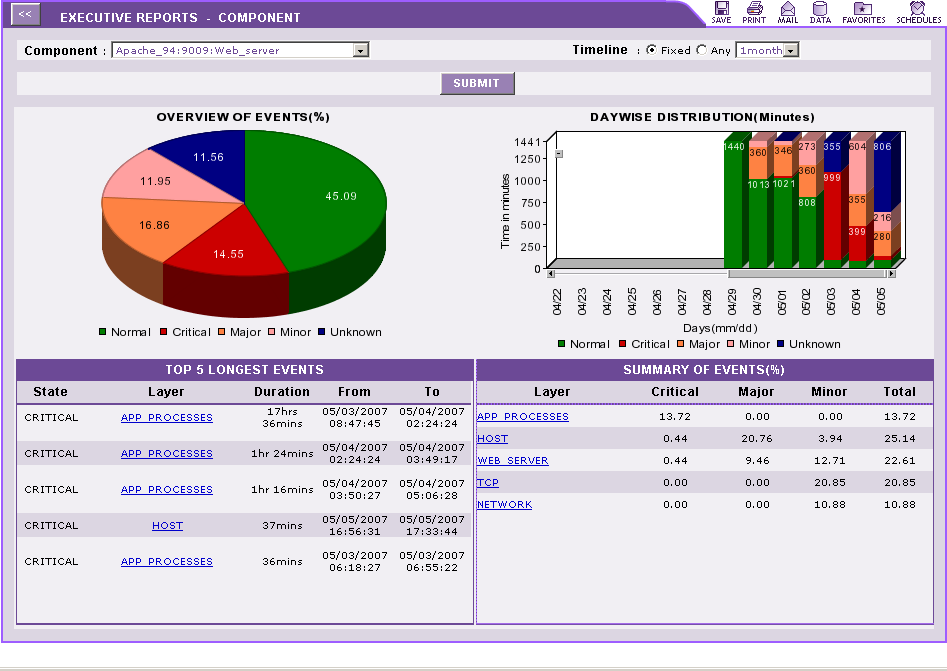
To look into the anomalies that have affected the service, click on Health% link to display the Executive Report. This report reveals when and what types of problems were impacting the service performance during the specified Timeline (see Figure 6).
- On the other hand, if the Background Save - PDF option is chosen from the Report Generation list, then clicking on the Run Report button will not generate the report and display it in this page for your benefit. Instead, a message indicating that the report is being processed in the background will appear. This will be accompanied by a link that will lead you to the page that lists all the reports that are being processed in the background, and their current status. If background report generation fails for a report, you can regenerate that report using this page, or can even delete that report if need be. On the other hand, if background processing successfully completes for your report, then, you can view a PDF of the report by clicking on the PDF icon in that page.