Synthetic Monitoring - HTTP Access Report
This report is ideal if you have configured multiple external agents to perform simulations that report the availability and responsiveness of a chosen web page of one/more components from an external perspective. Using this report, you can:
- Easily compare the historical simulation results of different agents;
- Accurately identify the agent that has reported issues much frequently than the rest;
- Accurately identify the web page that failed during simulation more frequently;
In order to generate the HTTP Access report, do the following:
- Select the HTTP Access option from the Synthetic Monitoring sub-node of the Domain Specific Reports node of the REPORTS BY FUNCTION tree.
-
Figure 1 then appears. Here, select a criterion for analysis from the Analysis by list box.
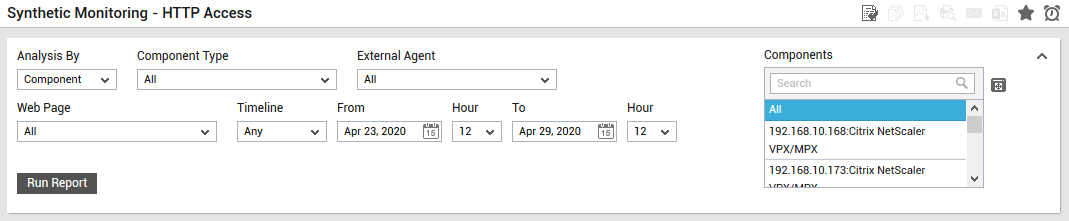
Figure 1 : Specifying the criteria for the HTTP Access report
-
Using this report, you can analyze the performance of one/more managed components, or those that are part of a zone, service or segment. The options provided by the Analysis By list box are discussed hereunder:
- Component: Select this option to choose the component(s) from across all the managed components in the environment.
- Zone: To generate a report for one/more components that are included in a zone, pick the Zone option. A Zone drop-down list will then appear, from which you would have to select the zone to which the components of interest to you belong to. A Sub zone flag also appears. Indicate whether the components present within the sub-zones of the chosen zone are also to be to be considered for report generation, by setting the Sub zone flag to Yes.
- Segment: If you want to generate a report for one/more chosen components that belong to a segment, select the Segment option from Analysis By list box, and then pick the Segment from the drop-down list that appears.
- Service: If you want to generate a report for one/more components involved in the delivery of a service, select the Service option from Analysis By, and then pick the required Service from the drop-down list that appears.
- Pick a Component Type for which the report is to be generated. By default, All option is chosen from this list.
- The Components list will be populated with all the components that are managed in your environment for the chosen component type. If the Components list consists of too many components, then viewing all the components and selecting the ones you need for report generation could require endless scrolling. To avoid this, you can click the
 button next to the Components list. A Components pop up window will then appear using which you can view almost all the components in a single interface and Select the ones to be included in this report.
 -
Next, from the External Agent list pick the agent for which the report needs to be generated to analyze the simulation performed by the agent. By default, All option is chosen from this list. If only a single agent is configured in your environment, then that particular agent will be chosen by default, from the External Agent list.
- Pick a web page that needs to be simulated from the Web Page list. By default HomePage will be chosen from this list.
-
Then, specify the Timeline for the graph. You can either provide a fixed time line such as 1 hour, 2 days, etc., or select the Any option from the list to provide a From and To date/time for report generation.
Note:
For every user registered with the eG Enterprise system, the administrator can indicate the maximum timeline for which that user can generate a report. Once the maximum timeline is set for a user, then, whenever that user logs into eG Reporter and attempts to generate a report, the Timeline list box in the report page will display options according to the maximum timeline setting of that user. For instance, if a user can generate a report for a maximum period of 3 days only, then 3 days will be the highest option displayed in the Timeline list - i.e., 3 days will be the last option in the fixed Timeline list. Similarly, if the user chooses the Any option from the Timeline list and proceeds to provide a start date and end date for report generation using the From and To specifications, eG Enterprise will first check if the user's Timeline specification conforms to his/her maximum timeline setting. If not, report generation will fail. For instance, for a user who is allowed to generate reports spanning over a maximum period of 3 days only, the difference between the From and To dates should never be over 3 days. If it is, then, upon clicking the Run Report button a message box will appear, prompting the user to change the From and To specification.
-
In addition to the settings discussed above, this report comes with a set of default specifications. These settings are hidden by default. If you do not want to disturb these default settings, then you can proceed to generate the report by clicking the Run Report button soon after you pick one/more components for report generation. However, if you want to view and then alter these settings (if required), click on the
 icon. The default settings will then appear in the MORE OPTIONS drop down window (See Figure 2). The steps below discuss each of these settings and how they can be customized.
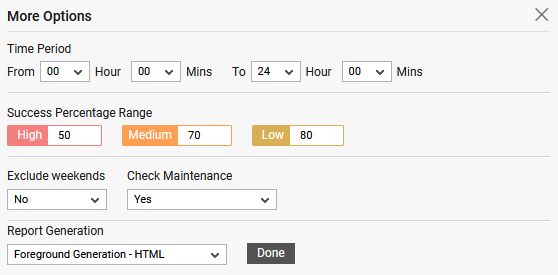
Figure 2 : The default settings for generating the HTTP Access report
-
Indicate the report Time Period for which the report is to be generated.
Note:
By default, the Time Period is set to 24 hours. Accordingly, the From and To parameters in the [timeframe] section of the eg_report.ini file (in the <eg_install_dir>\manager\config directory) are set to 00:00 and 24:00 respectively. If need be, you can override this default setting by configuring a different timeframe against the From and/or To parameters.
-
eG Enterprise offers the flexibility of allowing the administrators to view the abnormalities noticed in metrics collected for one/more servers/applications via protocol emulation from the generated report at a single glance. This can be achieved by providing the lower/higher threshold limits of your choice i.e., providing the High/Medium/Low values in the appropriate colored text boxes underneath the Success Percentage Range option. Doing so, whenever the metrics obtained via protocol emulation violates the specified threshold values, the Success (%) column in the generated report of that particular server/application will be highlighted with the appropriate color specified against the High/Medium/Low values. By default, 50 is specified against High, 70 is specified against Medium and 80 is specified against Low. This way, administrators can figure out accessibility and latency issues of the servers/applications if any, at a single glance.
-
If the timeline specified for the report needs to exclude the data collected during the Weekends, then set Exclude weekends to Yes (Saturday,Sunday). If not, select No.
Note:
By default, the weekend constitutes Saturday and Sunday. To override this default setting, do the following:
- Edit the eg_report.ini file in the <EG_INSTALL_DIR>\manager\config directory.
- In the [EXCLUDE_WEEKEND] section of the file, the Days parameter is set to Saturday,Sunday by default. You can modify this by setting the Days parameter to a comma-separated list of other days of the week - say Friday,Saturday.
- Save the file after making the required changes.
-
In some environments, to perform one/more administrative activities on a few severs, administrators may deliberately put those servers under maintenance. While generating reports for those servers, administrators may want to ignore the time for which the servers were under maintenance i.e., consider that the servers were up and running during the maintenance period. To this effect, the Check Maintenance list is set to Yes, by default. If you wish to generate the report considering the maintenance period as downtime, then choose No from this list.
-
In large environments, reports generated using months of data can take a long time to complete. Administrators now have the option of generating reports on-line or in the background. When a report is scheduled for background generation, administrators can proceed with their other monitoring, diagnosis, and reporting tasks, while the eG manager is processing the report. This saves the administrator valuable time. To schedule background processing of a report, you can either select the Background Save - PDF option from the Report Generation list. In this case, a Report Name text box will appear, where you would have to provide the name with which the report is to be saved in the background. To process reports in the foreground, select the Foreground Generation - HTML option from this list.
Note:
- The Report Generation list will appear only if the EnableBackgroundReport flag in the [BACKGROUND_PROCESS] section of the eg_report.ini file (in the {EG_INSTALL_DIR}\manager\config directory) is set to Yes.
- The default selection in the Report Generation list will change according to the Timeline specified for the report. If the Timeline set is greater than or equal to the number of days specified against the MinDurationForReport parameter in the [BACKGROUND_PROCESS] section of the eg_report.ini file, then the default selection in the Report Generation list will be Background Save - PDF. On the other hand, if the Timeline set for the report is lesser than the value of the MinDurationForReport parameter, then the default selection in the Report Generation list will be Foreground. This is because, the MinDurationForReport setting governs when reports are to be processed in the background. By default, this parameter is set to 2 weeks - this indicates that by default, reports with a timeline of 2 weeks and above will be processed in the background.
- Click the Done button once you have made the necessary changes in Figure 2.
- Finally, click the Run Report button to generate the report.
-
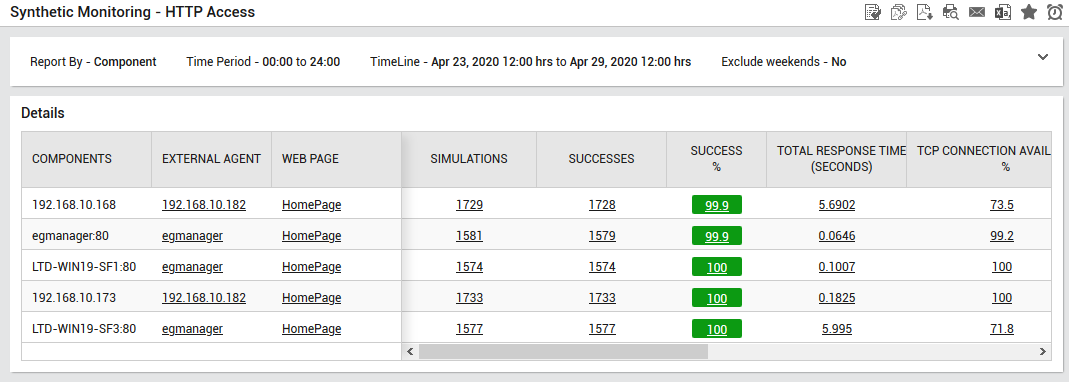
If the Report type is Foreground Generation - HTML and All option is chosen from the External Agent list, then Figure 3 will appear as soon as you click the Run Report button.
-
If you have chosen an External Agent, then this report provides the following:
- The total number of simulations performed;
- The number of simulations that were successful;
- The percentage of successful simulations;
- The total response time and
- .The Transaction availability.
-
Clicking on any value in Figure 3 will lead you to Figure 4 which provides all simulations performed by the simulator for the chosen component.
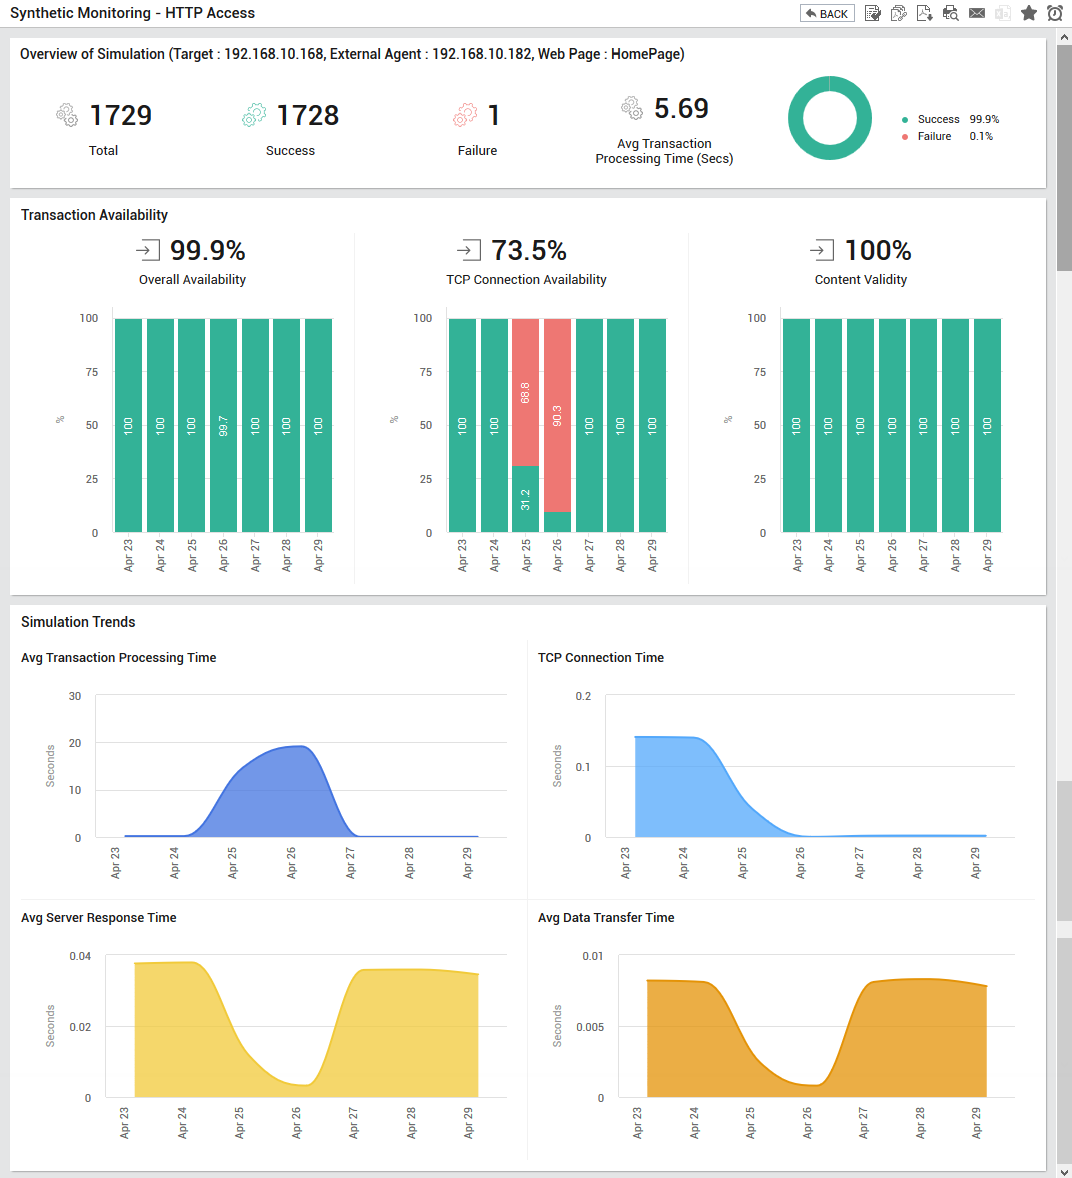
- From Figure 4, you can instantly infer whether the HTTP simulations have failed more often than they have succeeded. If so, when exactly the transactions failed? The Simulation trend enumerates the average transaction processing time, TCP connection time, average server response time and the rate at which data was being transferred over a chosen period of time. You can also use the graphs to figure out when the transaction availability had suffered failures. You can then use the graphs in this page to isolate exactly when during the given timeline, availability transactions failed or took longer than usual. This will reveal whether the simulation was healthy or in an abnormal state the majority of time.
- On the other hand, if the Background Save - PDF option is chosen from the Report Generation list, then clicking on the Run Report button will not generate the report and display it in this page for your benefit. Instead, a message indicating that the report is being processed in the background will appear. This will be accompanied by a link that will lead you to the page that lists all the reports that are being processed in the background, and their current status. If background report generation fails for a report, you can regenerate that report using this page, or can even delete that report if need be. On the other hand, if background processing successfully completes for your report, then, you can view a PDF of the report by clicking on the
 icon in that page.