Comparison Reports - Tests Report
The Comparison Reports - Components report is ideal if specific test results related to one or more components are chosen for comparison. The Comparison Reports - Tests report, on the other hand, can be used if the metrics collected by one test have to be plotted across multiple components. Such a report brings to light the best/worst candidates in a chosen performance area; more time and focus can then be reserved for the problem-prone components. For instance, using this report, you can compare the CPU utilization of all monitored components in the environment and identify the most CPU-intensive component. The procedure for generating this report is as given below:
-
Select the Tests option from the Comparison Reports sub node of the Analytical Reports node of the REPORTS BY FUNCTION tree.
-
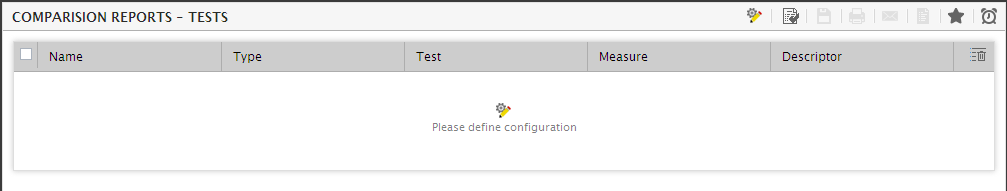
When Figure 1 appears, click on the Please define configuration to specify the criteria for comparing the metrics across multiple components.
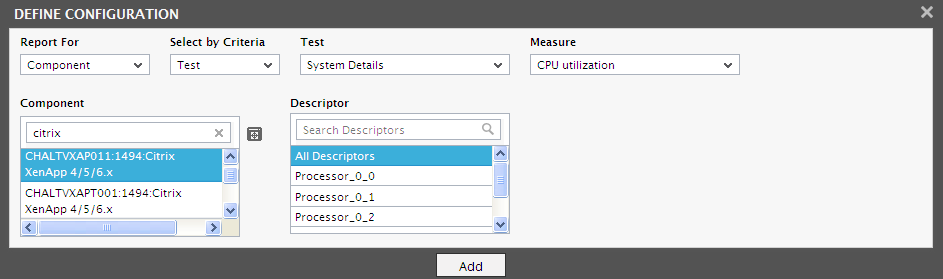
Figure 2 : Specifying the criteria for Comparison Reports - Tests
-
From Figure 2, select a filter criterion from the Report for list box. Administrators of large IT infrastructures, which are characterized by hundreds of components, may find it difficult to pick and choose the components for which a report is to be generated; this is because, in such environments, the Component list in this page will be populated with a large number of components, which would naturally make component selection tough. To enable administrators of such environments to quickly locate the components of interest to them and swiftly generate the reports, eG Enterprise provides a Report for list that consists of a variety of filter options. By default, the Component option is chosen from this list - this indicates that all the managed components of a chosen type will be available for selection in the Component list by default. In addition to this, the Report for list provides the following filter options as well:
- Service:If the component for which reports are to be generated is involved in the delivery of a particular service, then pick this option from the Report for list. Doing so will invoke a Service list from which a service name is to be chosen. Upon selection of a service, the component types that are part of the service will populate the Component type list in this page. Once you pick a component type, all components of that type, which are engaged in the delivery of the chosen service, will be displayed as candidates for selection in the Components list. If there are still too many components in the list to choose from, you can narrow your search further by using the Search text box. Specify the whole/part of the component name to search for in this text box, and click the
 icon next to it. The Component list will then be populated with all component names that embed the specified search string. Select the component of your choice from this list.
 - Segment:If the components for which a report is to be generated is part of a segment, pick the Segment option from the Report for list. Then, select the segment of interest to you from the Segment list. This will populate the Component type list with the types of components that are part of the chosen segment. If you select a component type from the Component type list, then, all components of that type, which are part of the chosen segment, will be displayed in the Components list for selection. If there are still too many components in the list to choose from, you can narrow your search further by using the Search text box. Specify the whole/part of the component name to search for in this text box, and click the icon next to it. The Component list will then be populated with all component names that embed the specified search string. Select the component of your choice from this list.
-
Zone:If the components for which a report is to be generated is part of a zone, pick the Zone option from the Report for list. To include sub-zones also in your search for components, set the Include SubZones flag to Yes. Then, select the zone of interest to you from the Zone list. This will populate the Component type list with the types of components that are part of the chosen zone. If you select a component type from the Component type list, then, all components of that type, which are part of the chosen zone, will be displayed in the Components list for selection. If there are too many components in the list to choose from, you can narrow your search further by using the Search text box. Specify the whole/part of the component name to search for in this text box, and click the
icon next to it. The Component list will then be populated with all component names that embed the specified search string. Select the component of your choice from this list.Since our example seeks to compare the CPU usage of all managed components in the environment, select the Component option from the Compare list.
- Service:If the component for which reports are to be generated is involved in the delivery of a particular service, then pick this option from the Report for list. Doing so will invoke a Service list from which a service name is to be chosen. Upon selection of a service, the component types that are part of the service will populate the Component type list in this page. Once you pick a component type, all components of that type, which are engaged in the delivery of the chosen service, will be displayed as candidates for selection in the Components list. If there are still too many components in the list to choose from, you can narrow your search further by using the Search text box. Specify the whole/part of the component name to search for in this text box, and click the
-
Next, you will need to choose between the Metrics and Test options from the Select by Criteria list. If you select the Test option, you will be expected to select a Test, then the Measure to be compared. For our example therefore, you will first have to select System Details test, then choose the CPU utilization measure, and finally select all the components displayed in the Component list (see Figure 3).
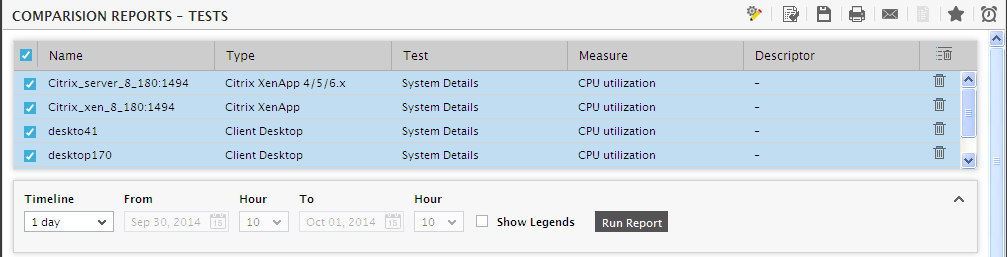
Figure 3 : Selecting a Test, Measure, and Component for comparison
-
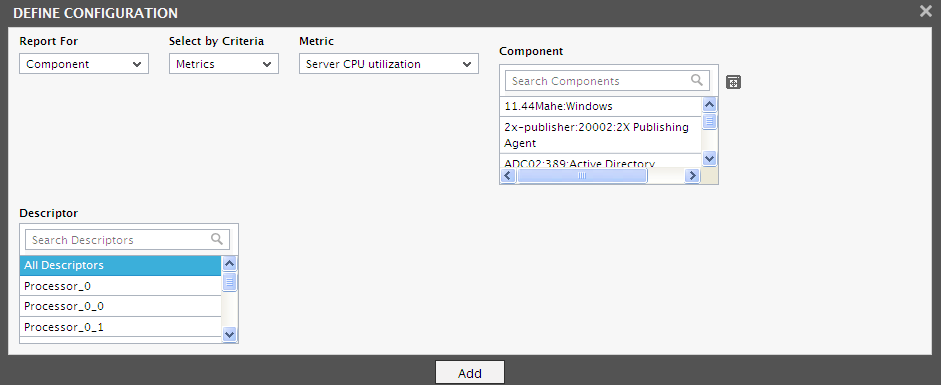
On the other hand, the Metrics option offers pre-defined test/measure combinations. When this option is chosen, you will see a pre-configured list of metrics displayed. Instead of selecting a specific Test and Measure as required by the Test option, you can simply select a performance parameter from the Metrics list, and then pick the components across which the parameter is to be compared. For our example therefore, you do not have to remember the test and measure that returns the desired CPU usage value; instead, just select the Server CPU utilization metric from the Metrics list, and select all the components from the Component list (see Figure 4).
-
By default, the Metrics list comes with a set of pre-configured parameters. You can expand the Metrics list by adding more performance parameters to it. To override the default Metrics list, edit the eg_report.ini file (in the <eg_install_dir>\manager\config directory), and add a new metric to the [report_templates] section therein, in the following format:
<DisplayName>=<InternalTestName>:<InternalMeasureName>
For example, to compare the availability of network connection to all the components in the infrastructure, do the following:
-
First, determine the Internal name of the test and measure to be configured. For that, do the following:
- Open the eg_lang*.ini file (from the <eg_install_dir>\manager\config directory), where * is the language code that represents the language preference that you have set using the user profile page. In this file, the component types, measure names, test names, layer names, measure descriptions, and a wide range of other display information are expressed in a particular language, and are mapped to their eG equivalents.
- Now, search the eg_lang*.ini file for the test name of interest to you. In the case of our example, search for “Network”.
- Once it is found, determine which internal eG test it is mapped to. For instance, the eG equivalent of the “Network” test is “NetworkTest”.
- Similarly, you can also find the internal measure name that eG Enterprise uses for referring to the Network availability measure; by default, this will be Availability.
-
Now that the eG internal names have been identified, proceed to configure the metric in the following manner:
Network availability=NetworkTest:Availability
The DisplayName, Network availability, will be added to the Metrics list of Figure 4.
-
- If the Component list consists of too many components, then viewing all the components and selecting the ones you need for report generation could require endless scrolling. To avoid this, you can click the
 icon next to the Component list. This will expand the Component list so that you can view almost all the components in a single interface and select the ones for which the report is to be generated.
 - If descriptors are relevant for the selected test/metric, a list of descriptors will be displayed in the Descriptor text box. You can select the descriptors for which reports are to be generated. If the Descriptor list consists of too many descriptors, then viewing all the descriptors and selecting the ones you need for report generation could require endless scrolling. To avoid this, you can click the icon next to the Descriptor list. This will expand the Descriptor list so that you can view almost all the descriptors in a single interface and select the ones for which the report is to be generated.
- To add the specification, click on the Add button. A separate entry for every chosen Component is then added as shown in Figure 3. Similarly, details pertaining to multiple tests/metrics can be added to this list box. To remove a specification, simply click on the check box corresponding to the specification, and click the
 button.
 - Next, pick and choose the specifications that need to participate in the analysis by clicking on the check box corresponding to every specification. In our case, all the listed entries are to be compared. Therefore, just click on the topmost check box in the column of check boxes to automatically select all the specifications at one shot.
-
Then, specify the Timeline for the graph. You can either provide a fixed time line such as 1 hour, 2 days, etc., or select the Any option from the list to provide a From and To date/time for report generation.
Note:
For every user registered with the eG Enterprise system, the administrator can indicate the maximum timeline for which that user can generate a report. Once the maximum timeline is set for a user, then, whenever that user logs into eG Reporter and attempts to generate a report, the Timeline list box in the report page will display options according to the maximum timeline setting of that user. For instance, if a user can generate a report for a maximum period of 3 days only, then 3 days will be the highest option displayed in the Timeline list - i.e., 3 days will be the last option in the fixed Timeline list. Similarly, if the user chooses the Any option from the Timeline list and proceeds to provide a start date and end date for report generation using the From and To specifications, eG Enterprise will first check if the user's Timeline specification conforms to his/her maximum timeline setting. If not, report generation will fail. For instance, for a user who is allowed to generate reports spanning over a maximum period of 3 days only, the difference between the From and To dates should never be over 3 days. If it is, then, upon clicking the Run Report button a message box will appear, prompting the user to change the From and To specification.
-
In addition to the settings discussed above, this report comes with a set of default specifications. These settings are hidden by default. If you do not want to disturb these default settings, then you can proceed to generate the report by clicking the Run Report button soon after you pick the measures that are to be compared. However, if you want to view and then alter these settings (if required), click on the
 button. The default settings will then appear in the MORE OPTIONS drop down window (see Figure 5). The steps below discuss each of these settings and how they can be customized.
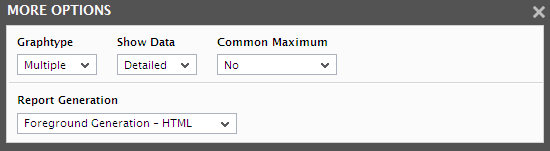
Figure 5 : The default settings for generating a Comparison Reports - Tests
- From Figure 5, select the Graph Type . To view a single graph that plots the values for all the selected components, select the Single option. If individual graphs for each of the selected components need to be viewed, then select the Multiple option (see Figure 5).
-
The speed with which a report is generated depends primarily on the report Timeline. While a Timeline that varies between a couple of days to a week enables the eG Enterprise system to quickly retrieve the required data, timelines that span multiple weeks/months could slow-down the data retrieval and report generation process to a considerable extent, owing to the volume of data involved. In order to ensure quick and easy access to reports, eG Enterprise provides you the option of enabling data retrieval from the Trend information in the database, instead of the Detailed test information that is used by default for report generation. The Detailed test information base comprises of multiple measurement records for a test - one or more each for every test execution. Whereas, the Trend information includes only hourly, daily, and monthly summary computations for a test performed on a continuous basis. For instance, during a period of 1 hour, a test that runs every 5 minutes inserts atleast 12 records into the Detailed test information base. On the other hand, the Trend information base would consist of only 1 record for the same 1 hour period. Fewer the number of records, query execution becomes much quicker, and data retrieval faster. To use the trend data for report generation, you will have to select the Trend option from the Show Data field in Figure 5. By default, the Detailed option is selected in Figure 5 indicating that the report data is retrieved from the detailed test information in the database. If need be, you can also ensure that all reports always use the Detailed test tables alone by hiding the Show Data field from the reporter interface. To achieve this, do the following:
- Login to the eG administrative interface as 'admin'.
- Select the Manager option from the Settings tile that appears when the
 button against the Admin tab is clicked.
 -
From the GENERAL SETTINGS page that then appears, if you set the Compute average/sum of metrics while trending flag to No, then the Show Data field will not appear in the reporter interface; this denies users access to the Trend option, and thus ensures that reports are always generated using the Detailed tables.
Note:
- A Trendreport will not include the data for the current day since trend data is only computed at the end of the day.
- If the Trend option is chosen, the time period of the report should be greater than 1 day.
-
The usage of Detailed test tables for generating reports, especially those that span weeks, increases the stress on the eG database, thus resulting in undue delays in report generation. In order to ensure that the database is not choked by such voluminous data requests, you can configure eG Enterprise to automatically "force" the use of the Trend option if the Timeline of a report exceeds a pre-configured duration. To specify this time boundary, do the following:
- Edit the eg_report.ini file in the <EG_INSTALL_DIR>\manager\config directory.
- In the [MISC] section of the file, you will find a DetailedTime parameter.
- Specify the duration (in days) beyond which Detailed reports cannot be generated, against the DetailedTime parameter, and save the eg_report.ini file.
- For instance, to make sure that Detailed reports are disallowed for a Timeline of over 2 weeks, set the DetailedTime parameter to 14 and save the file.
- Say, subsequently, you attempt to generate a Detailed report for a FixedTimeline of 3 weeks (which is greater than the 14-day limit set in our example). The instant you select the 3 weeks option from the Fixed list box, the Detailed option gets automatically disabled, and the Trend option gets enabled. Similarly, if you specify an AnyTimeline that runs over 14 days, then, upon clicking the Run Report button to generate the report, a message box appears (see Figure 8) informing you that only the Trend option is permitted.
- To proceed with the Trend report generation, click the ok button in the message box. To terminate Trend report generation, click the Cancel button.
- Typically, if the values of all the measures chosen for comparison are plotted in a single graph - i.e., if Graph Type is set to Single - then eG Enterprise automatically computes a maximum value for that graph based on the values reported by all the measures. However, if individual graphs are to be generated for each measure being compared - i.e., if Graph Type is set to Multiple - then, the maximum value will differ across graphs. This is because, in the case of the latter, by default, the maximum value for a graph is determined based on the values reported by a single measure during a specified timeline. This is why, the Common Maximum flag is set to No by default, if Graph Type is Multiple. The key limitation of having a maximum value per graph is the absence of a common basis for comparison. For instance, if you are comparing disk space usage across partitions using multiple graphs, you may find that the graph for disk C, where usage has varied between 60-80%, will have 80 as the maximum value, and the graph for disk D, where usage has varied between 40-50%, will have 50 as the maximum value. A quick look at these graphs may not instantly reveal which disk partition is experiencing a space crunch, as there will be no single threshold for comparison. Therefore, to effectively compare across graphs, and to be able to accurately isolate performance issues, you can set a common maximum value for all graphs displayed in this page. To achieve this, you need to set the Common Maximum flag to Yes. This common maximum value can be auto-computed by eG Enterprise or can be user-configured. To auto-compute the maximum value, set the Auto Maximum flag to Yes. By default, the Auto Maximum flag is set to No and if you want to specify a value of your choice as the common maximum value across graphs, then, proceed to provide a specific value in the Max Value field.
-
In large environments, reports generated using months of data can take a long time to complete. Administrators now have the option of generating reports on-line or in the background. When a report is scheduled for background generation, administrators can proceed with their other monitoring, diagnosis, and reporting tasks, while the eG manager is processing the report. This saves the administrator valuable time. To schedule background processing of a report, select the Background Save - PDF option from the Report Generation list. In this case, a Report Name text box will appear, where you would have to provide the name with which the report is to be saved in the background. To process reports in the foreground, select the Foreground Generation - HTML option from this list.
Note:
- The Report Generation list will appear only if the EnableBackgroundReport flag in the [BACKGROUND_PROCESS] section of the eg_report.ini file (in the {EG_INSTALL_DIR}\manager\config directory) is set to Yes.
- The default selection in the Report Generation list will change according to the Timeline specified for the report. If the Timeline set is greater than or equal to the number of days specified against the MinDurationForReport parameter in the [BACKGROUND_PROCESS] section of the eg_report.ini file, then the default selection in the Report Generation list will be Background. On the other hand, if the Timeline set for the report is lesser than the value of the MinDurationForReport parameter, then the default selection in the Report Generation list will be Foreground. This is because, the MinDurationForReport setting governs when reports are to be processed in the background. By default, this parameter is set to 2 weeks - this indicates that by default, reports with a timeline of 2 weeks and above will be processed in the background.
- Finally, click on the Run Report button to generate the report.
-
Graphs depicted by Figure 6 will then appear.
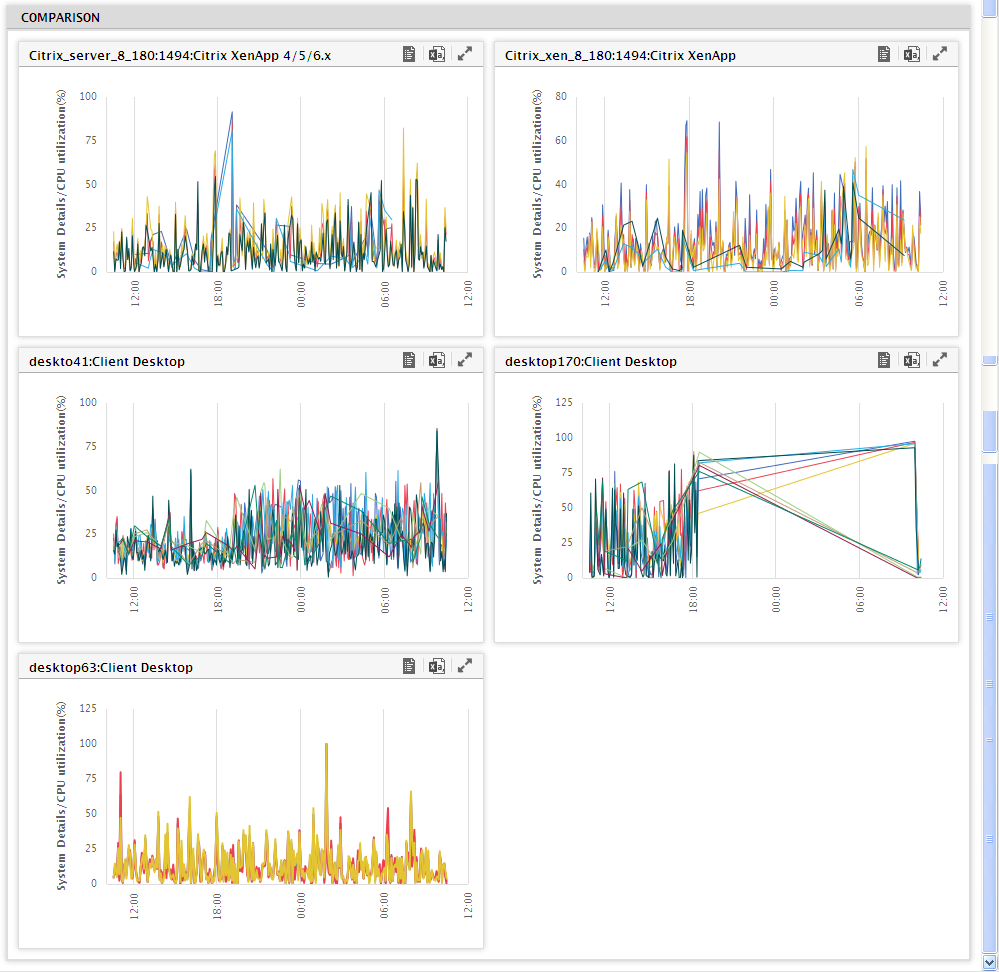
Figure 6 : A comparison report displaying individual graphs for every chosen component
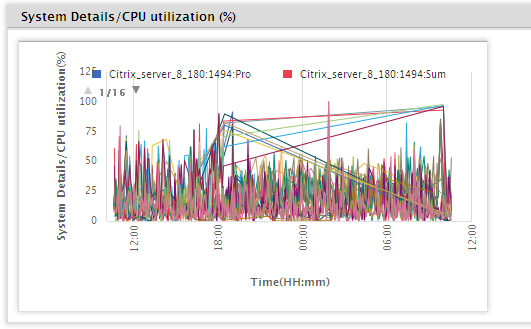
Figure 7 : A single graph comparing the CPU utilization across components
- The graph in Figure 6 will appear if the Graph Type chosen is Multiple. The graph in Figure 7 will appear if the Graph Type chosen is Single.