The eG Reporter
For enhanced historical reports and analysis, eG Enterprise includes an optional eG Reporter solution. The eG Reporter offers comprehensive pre-canned and customizable reports of the availability, performance, and usage of the target infrastructure. Various types of reports are available via eG Reporter including:
- Executive Summary Reports: These reports offer a service level summary for each component of the IT infrastructure. This summary depicts the percentage of time that a component has been problem free. The main intent of these reports is to help senior management of an organization identify which components or domains (i.e., component types) are most problem-prone in the IT infrastructure.
- App/Infra KPIs Reports: While executive summary reports provide a high-level overview of the performance of an infrastructure component, the App/Infra KPIs reports provide detailed insights into specific measurements and how they compare with their threshold bounds. While a number of pre-canned reports are available for each component being monitored, administrators also have the flexibility to build customized reports.
- Analysis Workbench Reports: While App/Infra KPIs reports allow analysis of different metrics of a specific component, comparison reports can be used for cross-correlation - i.e., to compare different metrics across different components. For example, the response time of the network, server, database, application, etc. can be compared and plotted in the same report. Also, snapshot reports are ideal for post-mortem analysis. If an administrator is aware that a problem occurred in the past during a certain period of time, he/she can use the Snapshot reports to quickly identify which measurements for a specific component were not in conformance with their thresholds. Users can also generate a few reports to assess the performance of chosen server farms/servers/services over time. Periodic analysis of overall performance enables administrators to accurately predict behavioral trends and sizing requirements, and thus perform effective capacity planning.
- Consolidated Analysis Reports: Use these reports to assess the performance of chosen server farms/servers/services over time. Periodic analysis of overall performance enables administrators to accurately predict behavioral trends and sizing requirements, and thus perform effective capacity planning.
- Domain Specific Reports: These reports facilitate root-cause analysis and identification in Citrix/Terminal/VDI server farms. Thinclient administrators can use these reports to assess the resource utilization of specific applications in the farm, analyze user behavior across the farm, detect the open sessions in the farm, etc. Reports can also be generated for real time monitoring of a website and for the transactions performed on the website. To enable users to oversee the performance of their virtualized infrastructure over time, and to analyze the resource usage patterns of VMs and physical servers deployed on various virtualization platforms, eG Reporter now includes Virtualization reports.
Using eG Reporter, users can login from anywhere, at any time, and view reports. By seamlessly integrating with eG Enterprise, eG Reporter allows users to analyze any of thousands of metrics collected by the eG agents for trending, capacity planning, problem diagnosis, or service level audits.
To open the eG Reporter, click on the Reporter tab page.
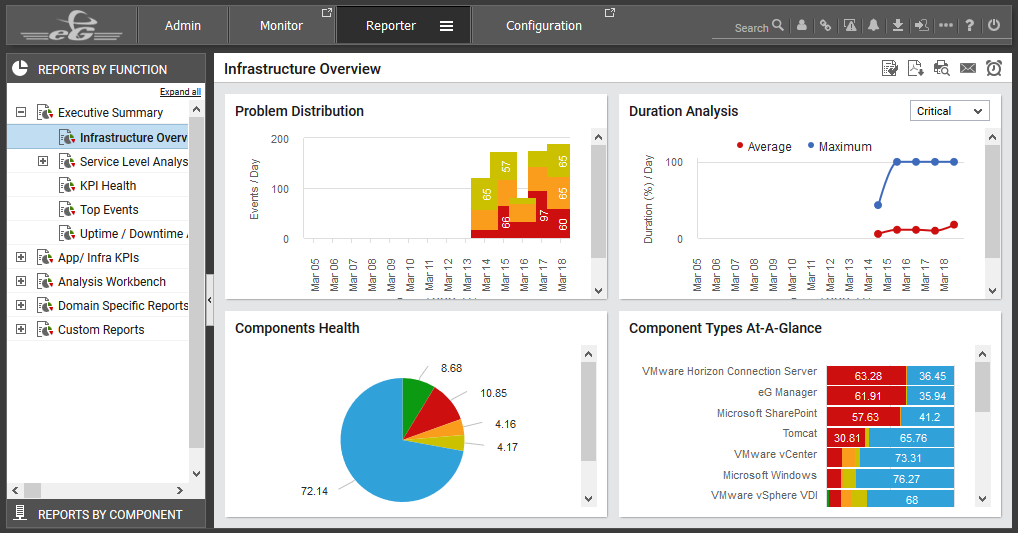
Figure 1 : The eG Reporter Home page
The eG Reporter Home page provides an overview of the health of the entire monitored infrastructure. The eG Reporter home page is divided into a left panel and a context sensitive right panel. The left panel consists of a host of tree structures using which reports can be generated easily. Using this left panel, administrators can find all the reports that are applicable to say for example, a specific component type easily. These reports are grouped in an easy to understand manner, so administrators need not click in several places to see the reports of most interest to them. Reports specific to component groupings such as zones, segments, and services are also available. By default, the REPORTS BY FUNCTION tree will be expanded (see Figure 1). This document will navigate through the nodes of the REPORTS BY FUNCTION tree and explain the generation of each report within the nodes in detail.
The MORE OPTIONS drop down window (see Figure 2) will appear when the  icon is clicked in Figure 1.
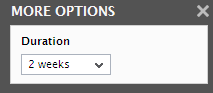
Figure 2 : Changing the duration for displaying the infrastructure health
The Duration list box (see Figure 2) allows the health of the monitored infrastructure to be analyzed for any period (default is 2 weeks).
In large multi service provider (MSP) environments, administrators may want a zone-wise overview of their infrastructure. For this purpose, a Report For list has been provided in the MORE OPTIONS drop down window. Administrators can select the Zone option from this list and choose a specific Zone to view the overview of that particular zone.
Note:
The default duration of the reports displayed in the eG Reporter home page can be changed using the homeDuration parameter in the [MISC] section of the eg_report.ini file (in the <EG_INSTALL_DIR>\manager\config directory). By default, this parameter is set to 2 weeks. However, it can be changed to a value in the range of 1 week to 4 weeks, or 1 month. For example, to set 1 week as the default duration, do as depicted below:
[MISC]
homeDuration=1week
Similarly, to set the default duration to 4 weeks, do as depicted below:
[MISC]
homeDuration=4weeks
The right panel displays the Infrastructure Overview. There are four sections in the INFRASTRUCTURE OVERVIEW. Each section sheds greater light on a critical aspect of the monitored environment.
-
The Problem Distribution section reveals how problem-prone the infrastructure has been during the period under consideration. The section displays bar graphs that indicate the number of critical, major, and minor problems that occurred on a daily basis during the selected period. By looking at this section, an administrator can determine the days when significant number of problems had occurred. Clicking on a particular division in a bar will lead you to Figure 3, which will reveal the TOP EVENTS report that provides a summary of events that affected infrastructure performance on that particular day.
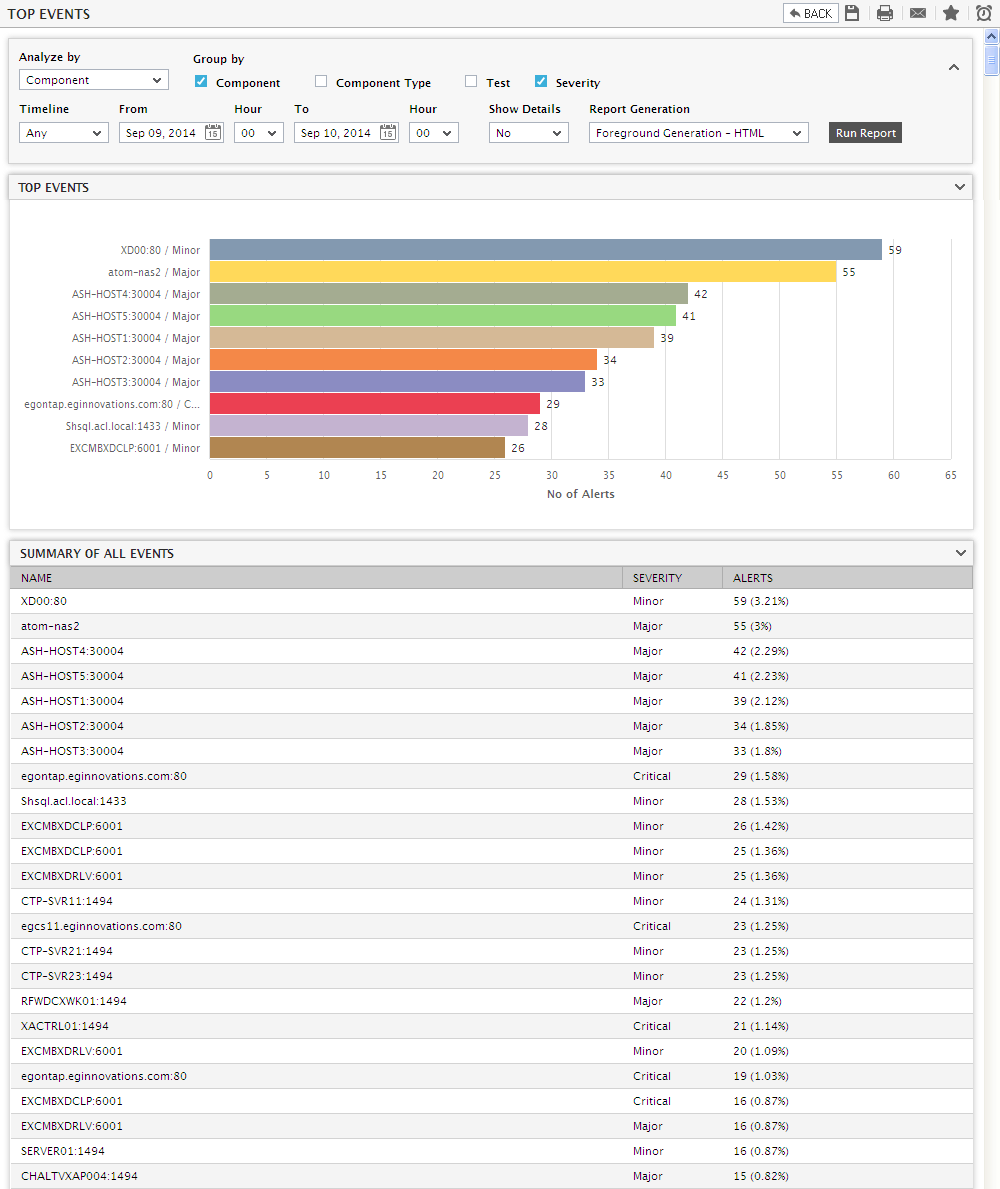
Figure 3 : Event Analysis report for a particular day
Note:
A mismatch between the total number of events reflected by the Problem Distributionsection of the Reporter home page and the TOP EVENTS report as such is inevitable. This is because, the former provides a layer-wise event summary, and the latter provides a test-wise summary.
-
Next to the Problem Distribution section in Figure 1 is the Duration Analysis section. This section shows the average duration and the maximum duration of events of a selected priority. For example, assume that an environment consists of 2 components - component A and component B. On a particular day, component A suffered Critical issues 5 times, with each issue lasting for about 2 hours. This implies that component A encountered critical issues for a total duration of 10 hours (2 x 5) that day. Component B on the other hand, suffered a critical issue at 12 noon, which was resolved at 4 PM, and another critical issue at 4.30 PM, which was resolved at 5.30 PM. Accordingly, it can be concluded that, component B suffered critical issues for a duration of 5 hours on that day. In such a case, the line graph in the Duration Analysis section will indicate that the average duration of Critical issues was 450 minutes (10+5=15/2=7.5 * 60=450) on this particular day, and the maximum duration was 600 minutes (i.e. 10 hours, which is the cumulative duration of all the critical events of component A; it is the maximum because the cumulative duration of critical events of component B is only 5).
This is a good indicator of the efficiency of the administrative staff in fixing the problems identified by eG. By default, this graph displays the average and maximum durations of the Critical issues in the environment. To view the details of issues of another priority, select the priority from the list box adjacent to the section heading Duration Analysis. To zero-in on the component that encountered problems (of the chosen priority) which remained unresolved for the longest duration, click on the graph. An Executive Summary Report of the component for the chosen period will then appear (see Figure 4).
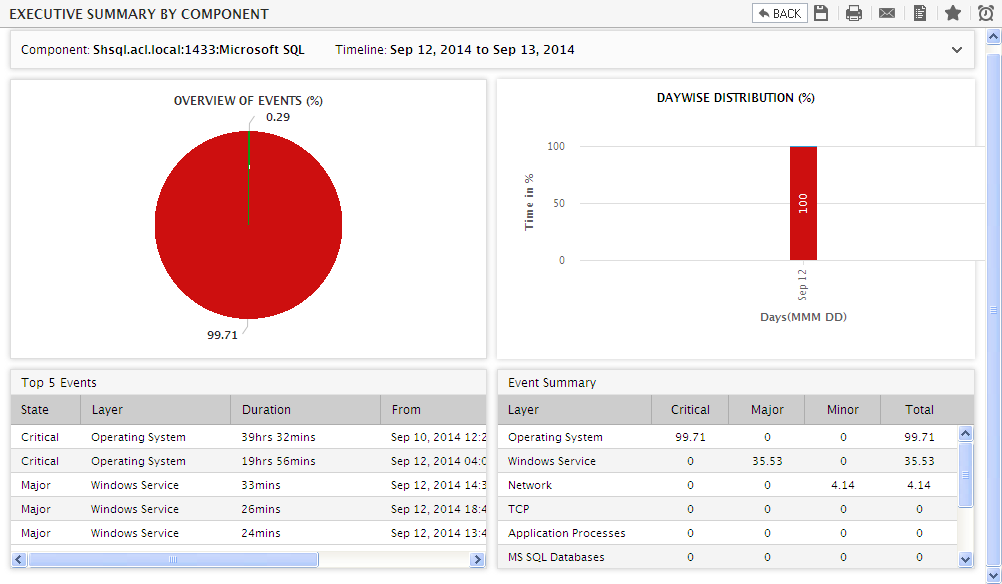
Figure 4 : Executive Report of the Component that encountered unresolvable problems
Note:
By default, the Duration Analysis section of the eG Reporter Home page depicts the duration of events in minutes. Instead, if you prefer to view the percentage of time during a day problems (of a chosen priority) persisted in the target environment, set the Daywise distribution reports in flag in the OTHER SETTINGS page of the eG administrative interface to Percentage. You can navigate to the OTHER SETTINGS page by clicking the Other Display Settings node in the MONITOR SETTINGS tree that appears when you traverse through the Settings ->Monitor menu in the eG administrative interface.
-
Just below the Problem Distribution section is the Services Health section, which reveals the health of the segments/services/components in the environment during the specified period. This section consists of a horizontal bar graph, each bar of which denotes the percentage of time a segment/service/component has been in the Normal/Critical/Major/Minor/Unknown states. Clicking on a particular division in a bar will lead you to a page that displays the Executive Summary By Service Report of the corresponding segment/service/component for the chosen Duration (see Figure 5).
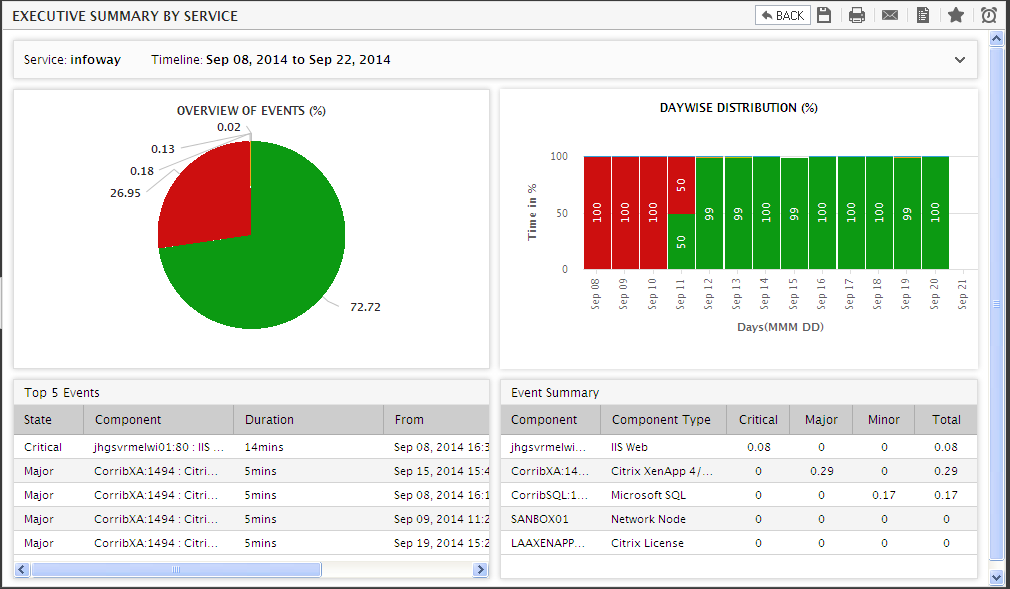
Figure 5 : An Executive Service Report that appears upon clicking on a bar in the Services Health section of the Reporter Home
-
From the Component Types At-A-Glance section, one can quickly infer, how well/how poorly each of the component types have performed during the given period. Clicking on the bar corresponding to a component type in this section will lead you to a page that displays the Executive Summary By Component Type Report pertaining to that component type for the chosen Duration (see Figure 6).
Note:
This section will depict the health of services, only when one or more services have been configured in the environment. If only segments have been configured, then this section will reveal the health of all the segments during the designated period. If neither services nor segments exist, then a pie chart denoting the health of all the monitored components will appear.
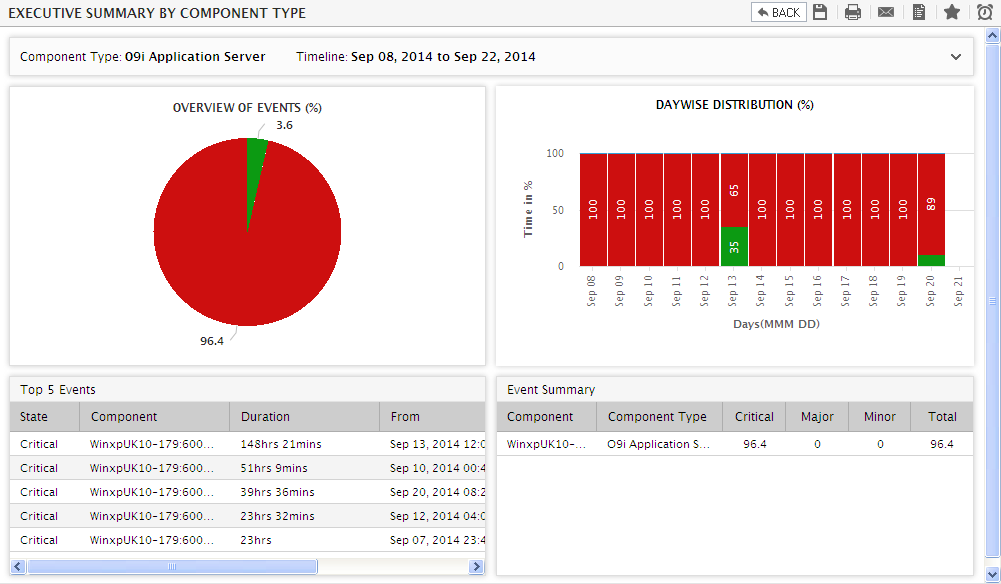
Figure 6 : An Executive Summary By Component Type Report that appears when a Component Type’s bar graph in the Reporter Home page is clicked
-
You can save the Reporter Home page as a PDF document by clicking on the
 button at the right top corner of Figure 6. Upon clicking, the following dialog box will appear:
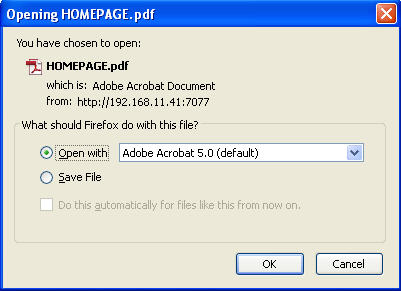
-
Selecting the Open with option in Figure 7 will save the report as a PDF file to a temporary folder, and automatically open the PDF. To save the file to a specific location in the local disk, select the Save File option and click the OK button. Doing so will open the Save As dialog box using which the name and location of the PDF file can be specified (see Figure 8). After specifying the required details, click the Save button in Figure 8 to save the report as a PDF.
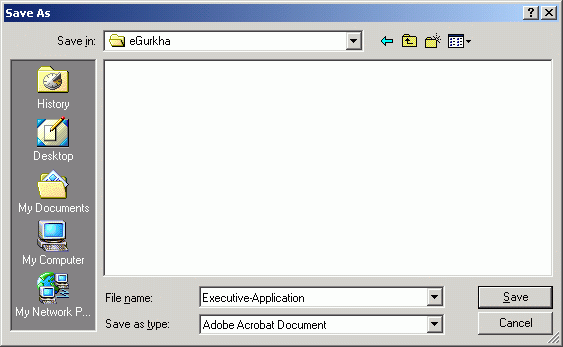
Figure 8 : Saving the report as a PDF file
Note:
The PDF files that are created while saving a report as a PDF, will contain the eG logo by default. To ensure that all PDF files so created carry your company logo instead, change the gif file specification provided against the pdfLogo parameter in the [MISC] section of the eg_report.ini file (in the <EG_INSTALL_DIR>\manager\config directory). By default, this parameter is set to logo.gif, which refers to the eG logo. Instead, you can specify the name of the gif file containing your company’s logo here, but before that, ensure that the image file is copied to the <EG_INSTALL_DIR>\manager\tomcat\webapps\final\reporter\images folder.
-
To print the report, click on the
 button in Figure 1. Upon clicking, you will be able to preview the graphs in a separate window. The preview will be followed by a Print dialog box, which allows you to select the printer and define its settings (see Figure 9).
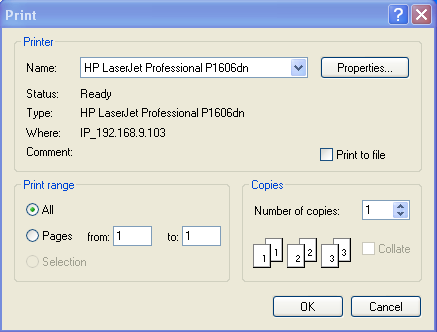
- Clicking on the OK button in Figure 9 will trigger the printing of the previewed report.
-
The eG Reporter component also facilitates mailing of the displayed reports directly to specific recipients. To achieve this, first, click on the
 button in Figure 1. Figure 10 will then appear, using which the mail IDs of the primary recipients, the mail IDs of the recipients to whom the reports need to be copied, etc. will have to be specified. Also, an appropriate Subject can be provided for the mail (see Figure 10).
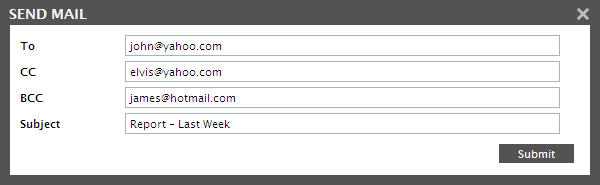
- Finally, click the Send button in Figure 10 to send the reports to the specified recipients.