Top Events Report
The Top Events report can be used to analyze the history of past events recorded by the eG Enterprise system, to determine which component, component type, or test is seeing the most number of events. Events can also be classified based on severity.
This report serves two main purposes. Administrators can use this report to identify which components or component types are seeing the most events. Using this report, administrators can determine where the “weak links” in their environment are. By classifying the events based on the test that generated the events, administrators can determine which tests are generating the most events. By verifying the authenticity of events being reported for the tests with the highest number of events, administrators can identify the tests for which the threshold settings may need to be tuned (thereby minimizing the number of “false” alerts generated by the system).
To generate a Top Events report, do the following:
- Select the Top Events option from the Executive Summary node of the REPORTS BY FUNCTION tree.
-
Figure 1 will then appear.
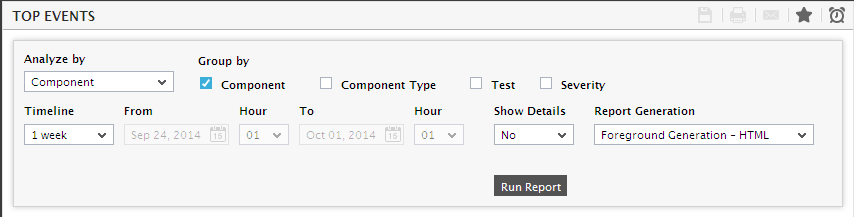
- If you want to perform an analysis of events pertaining to a particular zone/segment/service, then select the Zone, Segment, or Service option (as the case may be) from the Analyze by list box. You will then be prompted to select a specific Zone, Segment, or Service to be analyzed.
-
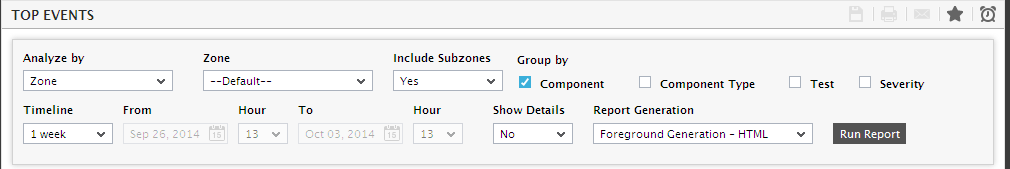
On the other hand, if you want to analyze the events related to all components across the monitored infrastructure, then select the Component option from the Analyze by list box (see Figure 2).
- Next, you will find that Figure 2 offers four check boxes. You can select any/few/all the available check boxes depending upon your reporting needs. For instance, to view the number of alerts that were generated for every component in the target environment or in the selected zone, service, or segment during a particular period, use the Component option from the Group by section of Figure 2. By default, the Component option is chosen.
-
Specify a Timeline for the report. You can either provide a fixed time line such as 1 hour, 2 days, etc., or select the Any option from the list to provide a From and To date/time for report generation.
Note:
For every user registered with the eG Enterprise system, the administrator can indicate the maximum timeline for which that user can generate a report. Once the maximum timeline is set for a user, then, whenever that user logs into eG Reporter and attempts to generate a report, the Timeline list box in the report page will display options according to the maximum timeline setting of that user. For instance, if a user can generate a report for a maximum period of 3 days only, then 3 days will be the highest option displayed in the Timeline list - i.e., 3 days will be the last option in the fixed Timeline list. Similarly, if the user chooses the Any option from the Timeline list and proceeds to provide a start date and end date for report generation using the From and To specifications, eG Enterprise will first check if the user's Timeline specification conforms to his/her maximum timeline setting. If not, report generation will fail. For instance, for a user who is allowed to generate reports spanning over a maximum period of 3 days only, the difference between the From and To dates should never be over 3 days. If it is, then, upon clicking the Run Report button a message box will appear, prompting the user to change the From and To specification.
- Then, proceed to indicate whether the resulting report should include detailed event descriptions or not. By default, the Event Analysis report displays an event summary along with a graph depicting event distribution across the chosen parameters (i.e., Component, Component Type, Test, and/or Severity). Accordingly, the Show Details flag is set to No by default. If you want the report to include complete event details, select the Yes option.
-
In large environments, reports generated using months of data can take a long time to complete. Administrators now have the option of generating reports on-line or in the background. When a report is scheduled for background generation, administrators can proceed with their other monitoring, diagnosis, and reporting tasks, while the eG manager is processing the report. This saves the administrator valuable time. To schedule background processing of a report, select the Background Save - PDF option from the Report Generation list. In this case, a Report Name text box will appear, where you would have to provide the name with which the report is to be saved in the background. To process reports in the foreground, select the Foreground Generation - HTML option from this list.
Note:
- The Report Generation list will appear only if the EnableBackgroundReport flag in the [BACKGROUND_PROCESS] section of the eg_report.ini file (in the [EG_INSTALL_DIR]\manager\config directory) is set to Yes.
- The default selection in the Report Generation list will change according to the Timeline specified for the report. If the Timeline set is greater than or equal to the number of days specified against the MinDurationForReport parameter in the [BACKGROUND_PROCESS] section of the eg_report.ini file, then the default selection in the Report Generation list will be Background. On the other hand, if the Timeline set for the report is lesser than the value of the MinDurationForReport parameter, then the default selection in the Report Generation list will be Foreground. This is because, the MinDurationForReport setting governs when reports are to be processed in the background. By default, this parameter is set to 2 weeks - this indicates that by default, reports with a timeline of 2 weeks and above will be processed in the background.
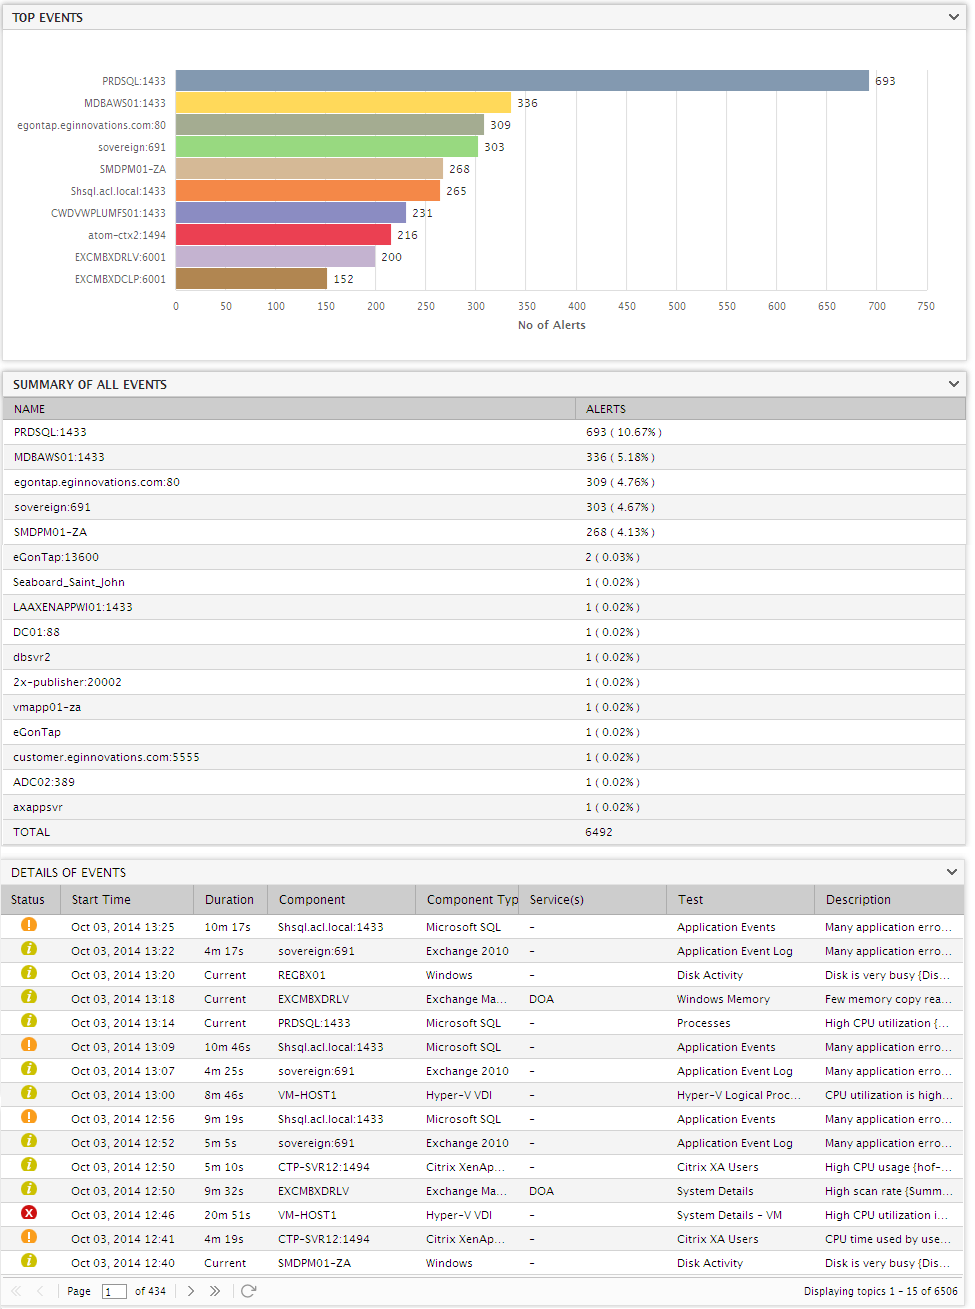
- Finally, click the Run Report button. If the option chosen from the Report Generation list is Foreground Generation - HTML, and if the Component check box had been selected earlier, then, clicking on the Run Report button will invoke Figure 3 which displays a bar chart of the top 10 problem-prone components in the monitored environment or in the chosen zone/segment/service. With the most problematic components thus revealed, you can instantly proceed to investigate the reasons for the performance degradation, and promptly initiate the necessary remedial measures.
-
To know how all the other components have performed, look below the bar chart. You will find a tabulated list of all the managed components in the environment or in the selected zone/ service/segment, and the number of alerts that were generated for every component during the specified Timeline. Every number so displayed will be expressed as a percentage of the total number of alerts (displayed at the end of the report), and this value will appear in brackets alongside the number. Moreover, if the Show Details flag had been set to Yes for the report, then an additional Details of events section will appear (see Figure 3), which will provide the complete details of the events summarized above.
-
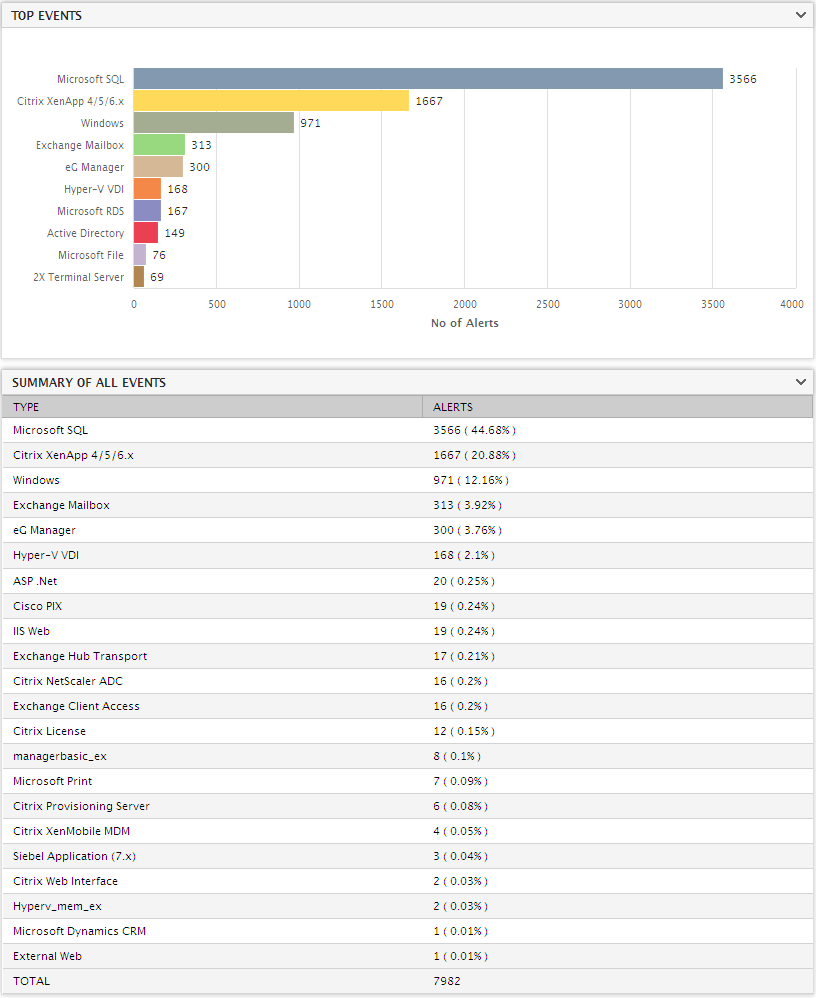
Similarly, if the Component Type option had been chosen from Figure 1, a bar chart revealing the top 10 problem-prone component-types will appear (see Figure 4). Besides this, the complete list of problem component-types in the infrastructure or in the chosen zone/service/segment, and the number of problems they encountered during the specified Timeline will also be available. The list is sorted in the descending order of the number of alerts.
-
Likewise, if the test option had been chosen earlier, then, the resulting report will enable you to identify at a single glance, the performance areas that have been hit badly during a particular period. The details provided by this report include the following:
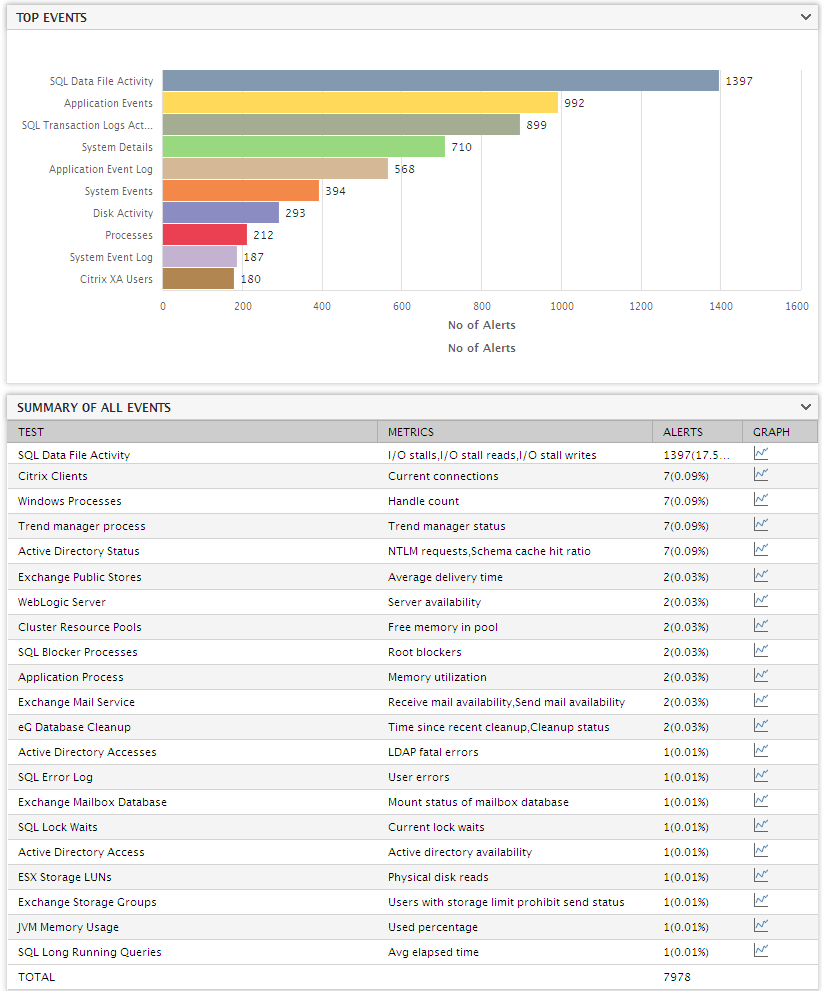
- A bar chart (see Figure 5) denoting the top-10 tests that reported the maximum number of performance issues; a quick glance at this bar chart enables administrators to easily identify the worst performance areas in the environment as a whole or in the chosen zone/segment/service, and assess how badly they have been affected.
-
A table that displays the complete list of tests that executed in the environment or in the zone/service/segment, and the number of ALERTS per test (see Figure 5); accompanying every test is a comma-separated list of problem measures reported by that test, in brackets; this list is sorted in the descending order of the number of alerts, and provides an overview of the test behavior.
-
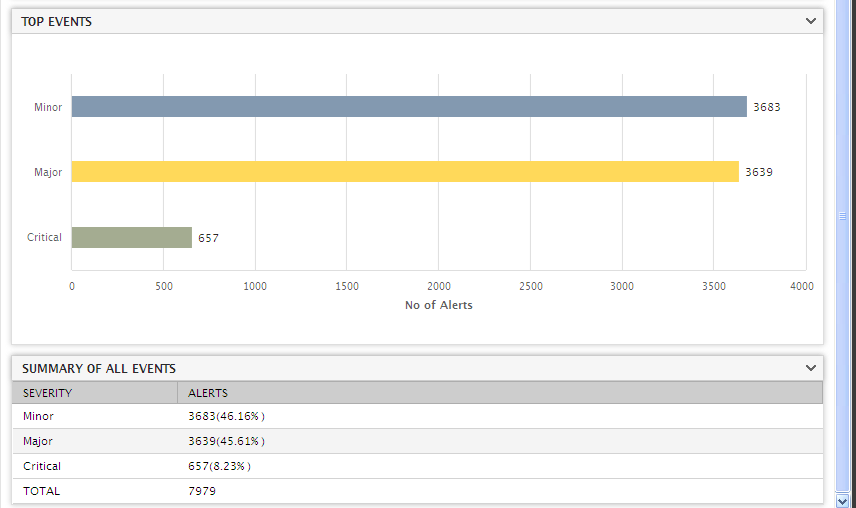
On the other hand, if you had chosen the severity option from Figure 1, then, you would be able to view the number of critical, major, and minor issues that attacked the environment or the selected zone/service/segment during a given period. This again is graphically represented and available as a tabulation as well, and clearly indicates the type of errors that were common (see Figure 6) during the specified timeline.
-
For a deeper insight into the event patterns in your infrastructure or in the zone/segment/service that you have chosen for analysis, you can employ a combination of the parameters provided in Figure 1 - i.e., you can choose multiple options from the event analysis page. For instance, selecting all the four options from Figure 1, will generate the report depicted by Figure 7.

- As you can see, Figure 7 displays a bar chart depicting the top-10 event producing combinations. Below the bar chart, is a table that reveals the problem tests and measures for every component in the target environment (or in the zone/service/segment), the number and percentage of alerts that were generated for that component, the alert type (whether critical, major, or minor), and the corresponding component-type. A quick look at this report helps you easily identify the bottleneck areas and the type of issues these areas are been plagued by, so that steps for an early resolution can be immediately taken.
- If you want this event summary to be supplemented by detailed event information, then set the Show Details flag in this page to Yes. Doing so invokes a report consisting of a bar chart, followed by an event summary, and finally, a detailed event-by-event history, which includes the start time of the event, event duration, the affected component, component type, test, and service, and a brief event description.
- On the other hand, if the Background Save - PDF option is chosen from the Report Generation list, then clicking on the Run Report button will not generate the report and display it in this page for your benefit. Instead, a message indicating that the report is being processed in the background will appear. This will be accompanied by a link that will lead you to the page that lists all the reports that are being processed in the background, and their current status. If background report generation fails for a report, you can regenerate that report using this page, or can even delete that report if need be. On the other hand, if background processing successfully completes for your report, then, you can view a PDF of the report by clicking on the
 icon in that page.