Top System Resource Consumers Report
While the System Performance report reveals irregularities in system resource usage, the Top System Resource Consumers report turns the spotlight on the root-cause of these usage excesses. For instance, using the System Performance report, you can proactively detect a potential contention for the CPU resources of a system. Using the Top System Resource Consumers report thereafter, you can identify which process on that system is consuming the CPU resources excessively, and is thus causing the resource contention.
To generate the Top System Resource Consumers report, do the following;
-
Select the Top System Resource Consumers option from the Operational Reports node of the REPORTS BY FUNCTIONS tree. Figure 1 will then appear.
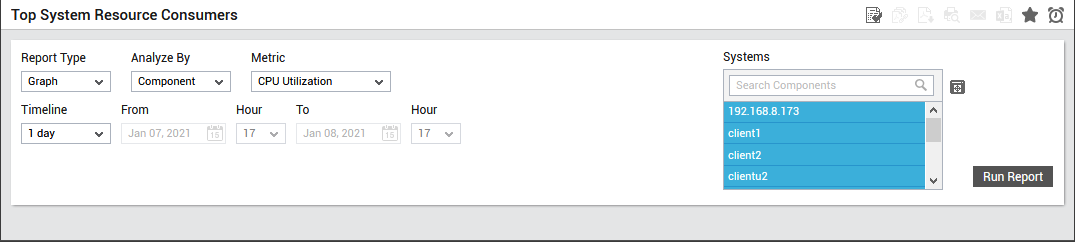
Figure 1 : Generating the Top System Resource Consumers report
-
From Figure 1, choose a Report Type (Graph or Data). The default Report Type is Graph. To closely observe and clearly understand the behavior of a single performance parameter across systems, you can plot a single measure's data alone in a Graph report (see Figure 1).
-
Then, select a criterion for analysis from the Analyze By list box. Using this report, you can analyze the performance of one/more components, or those that are part of a service or a segment. The options provided by the Analyze By list box are discussed hereunder:
- Component:Select this option to choose the component(s) from across all the managed components in the environment. For instance, for a report on CPU utilization of on all the managed systems in the environment, select Component from the Analyze By list. Next, select all the hosts listed in the Systems list. If the Systems list consists of too many components, then viewing all the components and selecting the ones you need for report generation could require endless scrolling. To avoid this, you can click the
 button next to the Components list. The COMPONENTS pop up window will then appear using which you can view almost all the components in a single interface and Select the ones for which the report is to be generated. You can narrow your search further by using the Search text box. Specify the whole/part of the component name to search for in this text box, and click the
  icon next to it.
 - Service: If the system for which reports are to be generated is involved in the delivery of a particular service, then pick this option from the Analyze By list. Doing so will invoke a Service list from which a service name is to be chosen. Once you pick a service, all systems which are engaged in the delivery of the chosen service, will be displayed as candidates for selection in the Systems list. Select the systems of your choice from this list.
- Segment: If the systems for which a report is to be generated are part of a segment, pick the Segment option from the Analyze By list. Then, select the segment of interest to you from the Segment list. Then, all systems, which are part of the chosen segment, will be displayed in the Systems list for selection. Select the systems of your choice from this list.
- Zone: If the systems for which a report is to be generated is part of a zone, pick the Zone option from the Analyze By list. To include sub-zones also in your search for components, set the Include SubZones flag to Yes. Then, select the zone of interest to you from the Zone list. This will populate the Systems list with the systems that are part of the chosen zone. Select the systems of your choice from this list.
- Component:Select this option to choose the component(s) from across all the managed components in the environment. For instance, for a report on CPU utilization of on all the managed systems in the environment, select Component from the Analyze By list. Next, select all the hosts listed in the Systems list. If the Systems list consists of too many components, then viewing all the components and selecting the ones you need for report generation could require endless scrolling. To avoid this, you can click the
-
Then, select a performance parameter from the Metric option that displays a pre-configured list of metrics for which the report can be generated. You can simply select a performance parameter from the list, for which you wish to view a detailed report across the systems. For example, just select the CPU Utilization metric from the Metrics list, and select all the systems for which you wish to view the detailed report from the Systems list. By default, the Metric list comes with a set of pre-configured parameters. You can expand the Metric list by adding more performance parameters to it. To override the default Metric list, edit the eg_report.ini file (in the <eg_install_dir>\manager\config directory), and add a new metric to the [report_templates] section therein, in the following format:
<DisplayName>=<InternalTestName>:<InternalMeasureName>
To determine the internal test and measure names, refer to the steps provided in theTop - N Analysis Report .
-
Then, select the period (Timeline) for which the graph is to be generated (see Figure 1). You can either provide a fixed time line such as 1 hour, 2 days, etc., or select the Any option from the list to provide a From and To date/time for report generation.
Note:
For every user registered with the eG Enterprise system, the administrator can indicate the maximum timeline for which that user can generate a report. Once the maximum timeline is set for a user, then, whenever that user logs into eG Reporter and attempts to generate a report, the Timeline list box in the report page will display options according to the maximum timeline setting of that user. For instance, if a user can generate a report for a maximum period of 3 days only, then 3 days will be the highest option displayed in the Timeline list - i.e., 3 days will be the last option in the fixed Timeline list. Similarly, if the user chooses the Any option from the Timeline list and proceeds to provide a start date and end date for report generation using the From and To specifications, eG Enterprise will first check if the user's Timeline specification conforms to his/her maximum timeline setting. If not, report generation will fail. For instance, for a user who is allowed to generate reports spanning over a maximum period of 3 days only, the difference between the From and To dates should never be over 3 days. If it is, then, upon clicking the Run Report button a message box will appear, prompting the user to change the From and To specification.
-
In addition to the settings discussed above, this report comes with a set of default specifications. These settings are hidden by default. If you do not want to disturb these default settings, then you can proceed to generate the report by clicking the Run Report button. However, if you want to view and then alter these settings (if required), click on the
 button. The default settings will then appear in the More Options drop down window (see Figure 2). The steps below discuss each of these settings and how they can be customized.
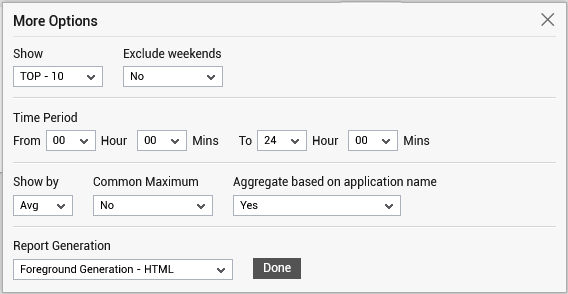
Figure 2 : The default settings for the Top System Resource Consumers report
-
If the timeline specified for the report needs to exclude the data collected during the Weekends, then set Exclude weekends to Yes. If not, select No.
Note:
You can configure the days of the week that need to be considered as a ‘weekend’ using the Days parameter in the [EXCLUDE_WEEKEND] section in the eg_report.ini file (in the <eg_install_dir>\manager\config directory). The Days parameter is set to Saturday,Sunday by default. To change this weekend specification, enter two other days of the week against the Days parameter.
-
By default, the report provides the details of only the Top-10 processes for all the chosen systems that consume high resources. You can choose a different top-n / last-n option from the Show list, if need be.
Note:
By default, the values displayed in the Show list range from top-10 to Last-10. This is because, the Showtop parameter in the [infos] section of the eg_report.ini file (in the <eg_install_dir>\manager\config directory) is set to 10, by default. You can, if required, configure the Show list to display a different range of options. For this, specify a different number against the Showtop parameter, and save the eg_report.ini file.
- Next, specify the start time and end time for report generation against the Time period field.
- By default, the Common Maximum flag is set to No. This indicates that by default, eG Enterprise does not set a common maximum value for all graphs in a report - in other words, the maximum value differs from graph to graph. This is because, the eG Enterprise system, by default, determines the maximum value for a graph by comparing all the values reported by the corresponding measure during the specified Timeline. If you want to set a common maximum value across all graphs in a view, set the Common Maximum flag to Yes. Once you set the Common Maximum value to Yes, the Auto Maximum and Max Value fields will appear. By default, the Auto Set Maximum Value flag is set to Yes. If this flag is set to No, you can set a custom maximum value for all the graphs in the Max Value field. If you set the Auto Set Maximum Value flag to Yes, then the maximum value will be auto-generated by the eG Enterprise system.
- Set the Aggregate based on application name flag to Yes if you wish to aggregate all the instances of an application and report as a single bar graph. If you set this flag to No, then the the complete file path of the application will be listed in the generated graph.
-
In large environments, reports generated using months of data can take a long time to complete. Administrators now have the option of generating reports on-line or in the background. When a report is scheduled for background generation, administrators can proceed with their other monitoring, diagnosis, and reporting tasks, while the eG manager is processing the report. This saves the administrator valuable time. To schedule background processing of a report, select the Background Save - PDF option from the Report Generation list. In this case, a Report Name text box will appear, where you would have to provide the name with which the report is to be saved in the background. To process reports in the foreground, select the Foreground Generation - HTML option from this list.
Note:
- The Report Generation list will appear only if the EnableBackgroundReport flag in the [BACKGROUND_PROCESS] section of the eg_report.ini file (in the {EG_INSTALL_DIR}\manager\config directory) is set to Yes.
- The default selection in the Report Generation list will change according to the Timeline specified for the report. If the Timeline set is greater than or equal to the number of days specified against the MinDurationForReport parameter in the [BACKGROUND_PROCESS] section of the eg_report.ini file, then the default selection in the Report Generation list will be Background. On the other hand, if the Timeline set for the report is lesser than the value of the MinDurationForReport parameter, then the default selection in the Report Generation list will be Foreground. This is because, the MinDurationForReport setting governs when reports are to be processed in the background. By default, this parameter is set to 2 weeks - this indicates that by default, reports with a timeline of 2 weeks and above will be processed in the background.
-
Finally, click on the Run Report button to generate the report. If the option chosen from the Report Generation list is Foreground Generation - HTML, then, clicking on the Run Report button will invoke Figure 3.
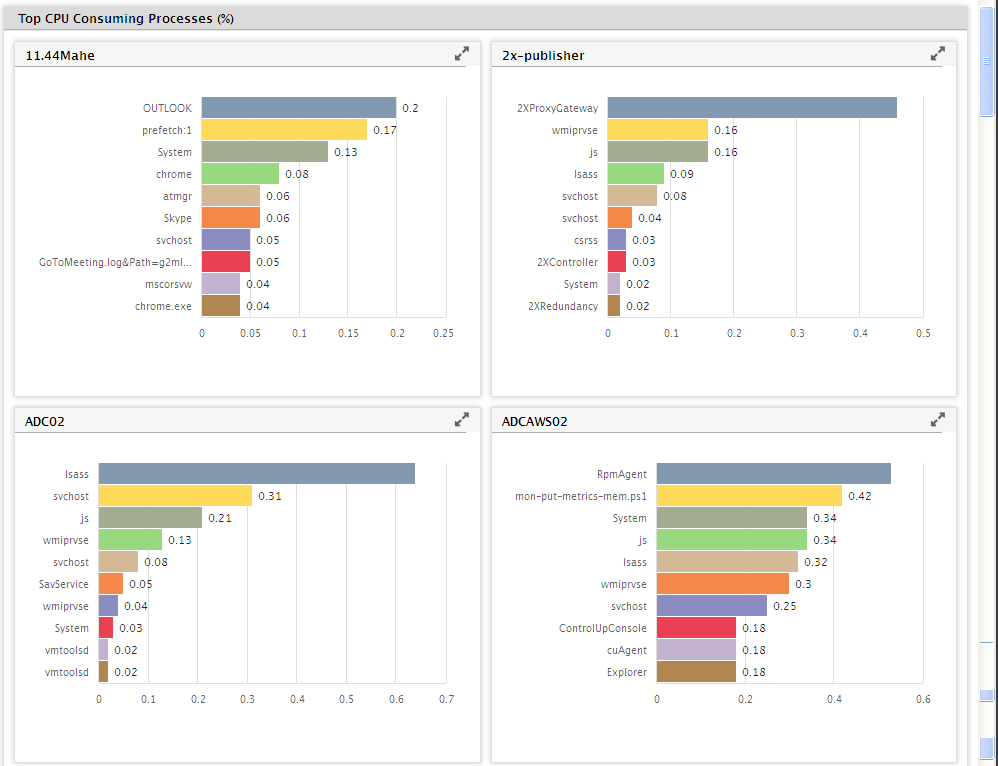
Figure 3 : The Top System Resource Consumers report
For each component chosen from the Systems list, the top 10 applications that are consuming the resources are plotted as bar graphs. However, if you wish to view the processes that are consuming the resources in the bar graph, then set the Aggregate based on application name flag available in the More Options drop down window to Yes.
If the Data option is chosen from the Report Type list, then the report will be generated as shown in Figure 4.
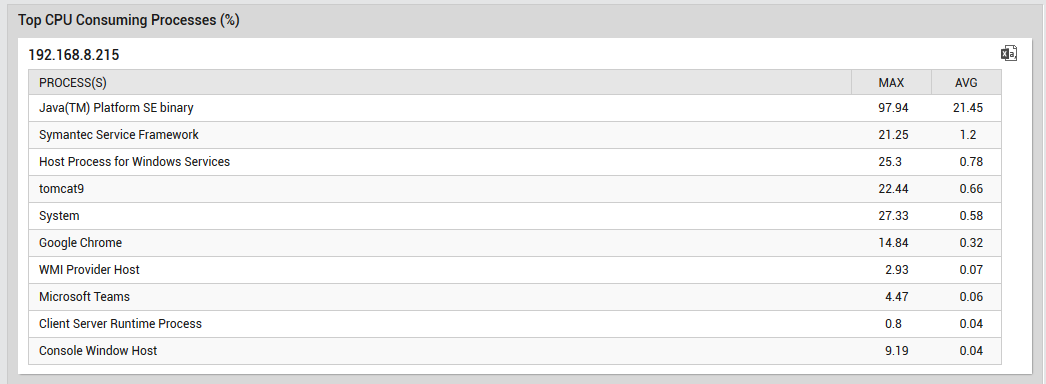
Figure 4 : The report when generated in Data format
From the tabular view represented in Figure 4, administrators can figure out the process that is consuming the maximum resources.