Uptime/Downtime Analysis Reports
Uptime is a key measure of the general health and availability of the critical servers and network devices in an IT infrastructure. Periodic uptime values that the eG agent reports for target servers and devices can alert you to unscheduled reboots that occurred recently; however, to effectively assess server/device availability over time, accurately determine unexpected and prolonged breaks in availability, and accordingly ascertain service level achievements/slippages, a look at the total uptime of a server/device and the total number of reboots it experienced over a period of time is necessary. To enable such an analysis for one/more critical components of an IT infrastructure, eG Enterprise provides Uptime/Downtime Analysis reports.
Using the Uptime/Downtime Analysis reports, you can figure out the following:
- Which servers/devices are the healthiest, in terms of availability?
- Which servers/devices have been down for the longest period of time? How long was each server/device unavailable during the specified timeline?
- How many times during the designated period did a server/device reboot? How many of these were scheduled reboots? How long was the server/device down before every reboot?
- Which servers had the least uptime/downtime and how many servers were available in the target environment?
To generate this report, do the following:
- Select the Uptime/Downtime Analysis option from the Executive Summary node of the REPORTS BY FUNCTION tree.
-
When Figure 1 appears, first indicate the Report Type to be generated. For viewing the uptime details of components in a table, choose the Details option. For graphically representing the uptime/downtime of chosen components, select the Summary option. By default, the Overview option is chosen from this list. By selecting the Overview option and generating this report, administrators would be able to figure out the total number of servers in their environment and quickly identify the number of servers with least uptime/downtime.
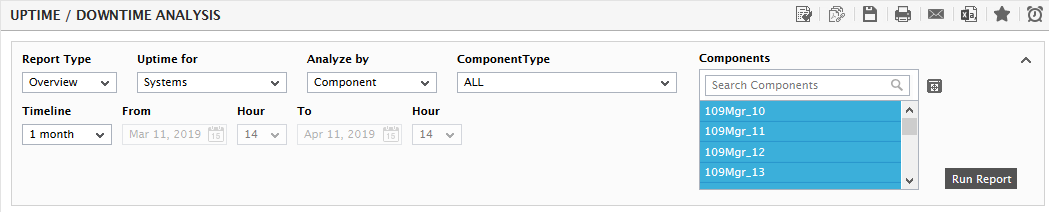
Figure 1 : Specifying the criteria for Uptime/Downtime Analysis reports
- Next, pick an option from the Uptime for list and indicate whether the report to be generated is for Systems or Network Devices.
- By default, selecting the Systems option from the Uptime for list will populate the Systems list box in Figure 1 with all the managed systems in the target environment. Similarly, by default, selecting the Network Devices option from the Uptime for list will populate the Network Devices list box that will appear in this case, with all the managed network devices in the target environment. You would have to pick and choose the systems/network devices for which the report is to be generated from the Systems or Network Devices list box (as the case may be).
-
This implies that in the case of large IT infrastructures characterized by hundreds of components, a large number of systems/network devices will be made available for selection in the Systems or Network Devices list boxes; selecting the desired components from this ‘endless’ list will hence become a painful exercise. To ease the pain involved in choosing the components for report generation, eG Enterprise provides an Analyze by list; by selecting an option from this list, you can quickly condense the Systems or Network Devices list and then swiftly identify the components of interest to you. By default, the Component option is chosen from the Analyze by list - this indicates that by default, the Systems and Network Devices list will display all the managed systems and network devices (as the case may be) in the target environment. The other options in the list include:
- Zone: To generate an uptime report for one/more components that are included in a zone, pick the Zone option. A Zone drop-down list will then appear, from which you would have to select the zone to which the components of interest to you belong. An Include Subzone flag also appears. Indicate whether the components present within the sub-zones of the chosen zone are also to be to be considered for report generation, by setting the Include Subzone flag to Yes.
- Segment: If you want to generate an uptime report for one/more components that belong to a segment, select the Segment option from Analyze by, and then pick the Segment from the drop-down list that appears.
- Service: If you want to generate an uptime report for one/more components involved in the delivery of a service, select the Service option from Analyze by, and then pick the required Service from the drop-down list that appears.
- Then, to further filter the components listed in the Systems (or Network Devices) list box, pick a Component Type - this way, only those systems/network devices that are of the chosen type will be available for selection in the Systems (or Network Devices) list box. By default, the ALL option is chosen here indicating that all managed systems/network devices in the target environment will be displayed in the Systems (or Network Devices) list box by default.
- Select the systems/network devices for which uptime reports are to be generated from the Systems or Network Devices list box (as the case may be). If the list consists of too many Systems or Network Devices, then viewing all the systems/network devices and selecting the ones you need for report generation could require endless scrolling. To avoid this, you can click the
 button next to the Systems or Network Devices list (as the case may be). The SYSTEMS/NETWORK DEVICES pop up window will then appear using which you can view almost all the systems/network devices in a single interface and select the ones for which the report is to be generated.
 -
Then, specify the Timeline for the graph. You can either provide a fixed time line such as 1 hour, 2 days, etc., or select the Any option from the list to provide a From and To date/time for report generation.
Note:
For every user registered with the eG Enterprise system, the administrator can indicate the maximum timeline for which that user can generate a report. Once the maximum timeline is set for a user, then, whenever that user logs into eG Reporter and attempts to generate a report, the Timeline list box in the report page will display options according to the maximum timeline setting of that user. For instance, if a user can generate a report for a maximum period of 3 days only, then 3 days will be the highest option displayed in the Timeline list - i.e., 3 days will be the last option in the fixed Timeline list. Similarly, if the user chooses the Any option from the Timeline list and proceeds to provide a start date and end date for report generation using the From and To specifications, eG Enterprise will first check if the user's Timeline specification conforms to his/her maximum timeline setting. If not, report generation will fail. For instance, for a user who is allowed to generate reports spanning over a maximum period of 3 days only, the difference between the From and To dates should never be over 3 days. If it is, then, upon clicking the Run Report button a message box will appear, prompting the user to change the From and To specification.
-
In addition to the settings discussed above, this report comes with a set of default specifications. These settings are hidden by default. If you do not want to disturb these default settings, then you can proceed to generate the report by clicking the Run Report button soon after you pick one/more Systems or Network Devices for report generation. However, if you want to view and then alter these settings (if required), click on the
 icon. The default settings will then appear in the MORE OPTIONS drop down window (See Figure 2). The steps below discuss each of these settings and how they can be customized.
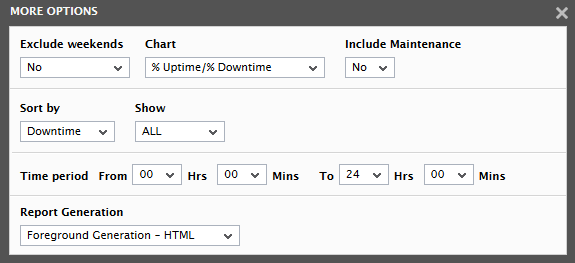
Figure 2 : The default settings for generating the Uptime/Downtime Analysis reports
- By default, the Uptime/Downtime Analysis report ignores all reboots that occur when a 'maintenance policy configuration' is active on a component - in other words, such reboots are by default excluded from the count of reboots displayed by the report. This default behavior is governed by the Include Maintenance flag, which is set to No by default. You can however, optionally configure the Uptime report to include reboots that occur during maintenance periods in its count of reboots. For this, set the Include Maintenance flag to Yes.
- If the timeline specified for the report needs to exclude the data collected during the Weekends, then set Exclude weekends to Yes. If not, select No.
-
If the Report Type is Detail, then, a Show Details flag will appear set to No by default. This indicates that, by default, the resulting Detail report will not provide reboot details. To view reboot details along with the uptime details, set the Show Details flag to Yes.
Note:
You can configure the days of the week that need to be considered as a ‘weekend’ using the Days parameter in the[EXCLUDE_WEEKEND]section in the eg_report.ini file (in the <eg_install_dir>\manager\config directory). The Days parameter is set to Saturday,Sunday by default. To change this weekend specification, enter two other days of the week against the Days parameter.
- If the Report Type you have chosen is Summary, then a Chart drop-down list will appear from which you can select how uptime/downtime should be represented in the graph - as a percentage? or in hours?. If the %Uptime/%Downtime option is chosen, then the resulting graph will plot the percentage of time for which the selected components have been up/down. On the other hand, if the Uptime/Downtime option is selected, then the graph will plot the total number of hours for which the chosen components have been up/down.
- Next, select the data on the basis of which the report should be sorted. By default, the Downtime option is chosen from the Sort by list.
-
Since the default Sort by option is Downtime, by default, the report provides the details of only the top-10 components with the maximum downtime. If a different Sort by option, say Reboots, is chosen, then the report, by default, will only pertain to the top-10 components in the environment, on the basis of the number of reboots. You can choose a different top-n / last-n option from the Show list, if need be.
Note:
By default, the values displayed in the Show list range from TOP-10 to LAST-10. This is because, the Showtop parameter in the [infos] section of the eg_report.ini file (in the <eg_install_dir>\manager\config directory) is set to 10, by default. You can, if required, configure the Show list to display a different range of options. For this, specify a different number against the Showtop parameter, and save the eg_report.ini file.
-
Next, indicate the report Timeperiod.
Note:
By default, the Timeperiod is set to 24 hours. Accordingly, the From and To parameters in the [timeframe] section of the eg_report.ini file (in the <EG_INSTALL_DIR>\manager\config directory) are set to 00:00 and 24:00 respectively. If need be, you can override this default setting by configuring a different timeframe against the From and/or To parameters.
-
In large environments, reports generated using months of data can take a long time to complete. Administrators now have the option of generating reports on-line or in the background. When a report is scheduled for background generation, administrators can proceed with their other monitoring, diagnosis, and reporting tasks, while the eG manager is processing the report. This saves the administrator valuable time. To schedule background processing of a report, you can either select the Background Save - PDF option or the Background Save - CSV option from the Report Generation list. In this case, a Report Name text box will appear, where you would have to provide the name with which the report is to be saved in the background. To process reports in the foreground, select the Foreground Generation - HTML option from this list.
Note:
- The Report Generation list will appear only if the EnableBackgroundReport flag in the [BACKGROUND_PROCESS] section of the eg_report.ini file (in the {EG_INSTALL_DIR}\manager\config directory) is set to Yes.
- The default selection in the Report Generation list will change according to the Timeline specified for the report. If the Timeline set is greater than or equal to the number of days specified against the MinDurationForReport parameter in the [BACKGROUND_PROCESS] section of the eg_report.ini file, then the default selection in the Report Generation list will be Background Save - PDF. On the other hand, if the Timeline set for the report is lesser than the value of the MinDurationForReport parameter, then the default selection in the Report Generation list will be Foreground. This is because, the MinDurationForReport setting governs when reports are to be processed in the background. By default, this parameter is set to 2 weeks - this indicates that by default, reports with a timeline of 2 weeks and above will be processed in the background.
- Finally, click the Run Report button.
-
If the Report Type is Overview and the option chosen from the Report Generation list is Foreground Generation - HTML, then clicking the Run Report button will reveal Figure 3.
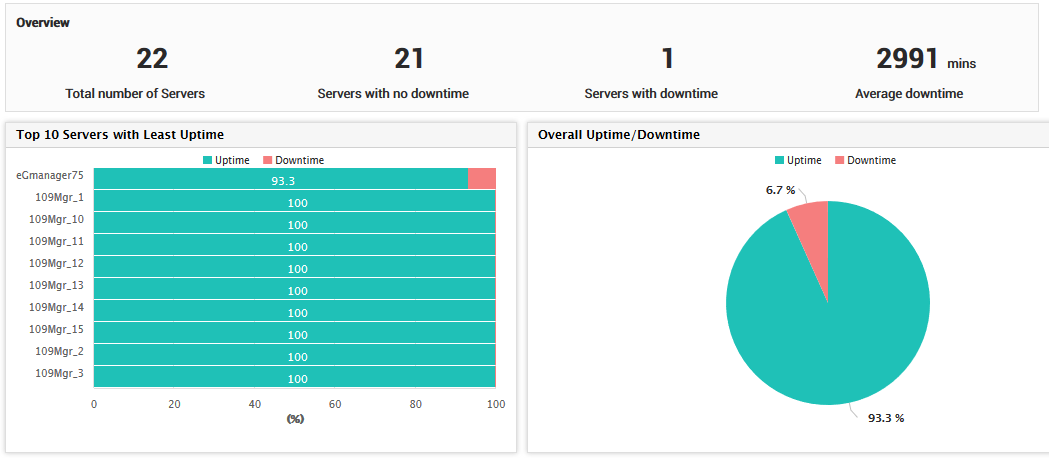
Figure 3 : The Uptime Downtime Analysis Overview report generated for a target environment
From Figure 3, administrators can figure out the following:
- A pie chart that reveals the percentage of time the servers in the target environment were up/down.
- A bar graph that reveals the top-10 uptime and downtime of the components chosen in the target environment. From this graph, you can easily identify the components that have been unavailable during the specified Timeline, and the duration of the unavailability.
- The Overview section reveals the total number of servers in the target environment, the servers that have not been down, the servers with downtime and the average downtime of the servers.
-
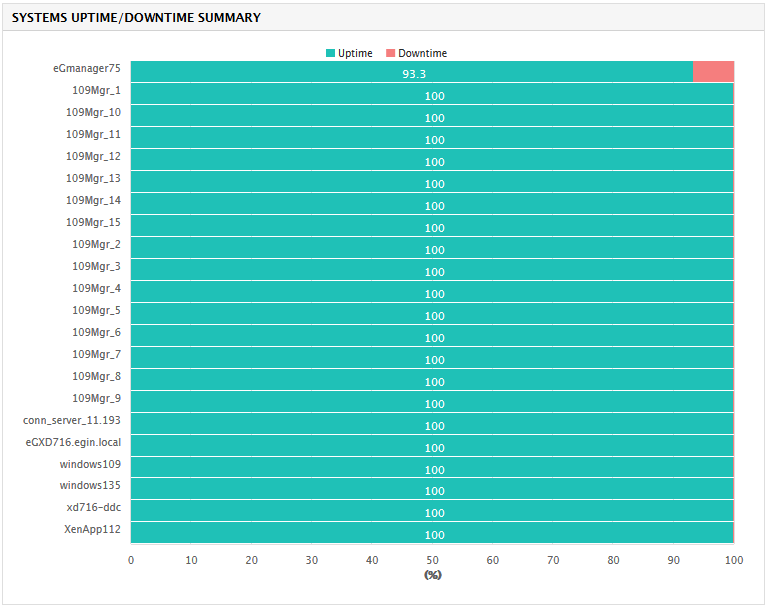
If the Report Type is Summary, and the option chosen from the Report Generation list is Foreground Generation - HTML, then clicking the Run Report button will reveal a bar graph (see Figure 4) depicting the uptime and downtime of the chosen components. From this graph, you can easily identify the components that have been unavailable during the specified Timeline, and the duration of the unavailability.
-
Clicking on the bar corresponding to any of the components displayed in Figure 4 will invoke Figure 5 which will allow you to zoom into the uptime details of that particular component. Besides providing a pie chart that depicts the percentage uptime and downtime of the chosen component, Figure 5 also provides the following useful information:
- The total duration for which the chosen component was up and running during the specified Timeline;
- The percentage uptime of the component;
- The total duration for which the chosen component was down during the specified Timeline;
- The percentage downtime of the component;
- The total number of reboots that the component experienced during the specified Timeline;
-
A Reboot Details section that indicates the following for every reboot:
- When the component was shutdown
- When the reboot occurred
-
The duration for which the component remained shutdown before being rebooted;
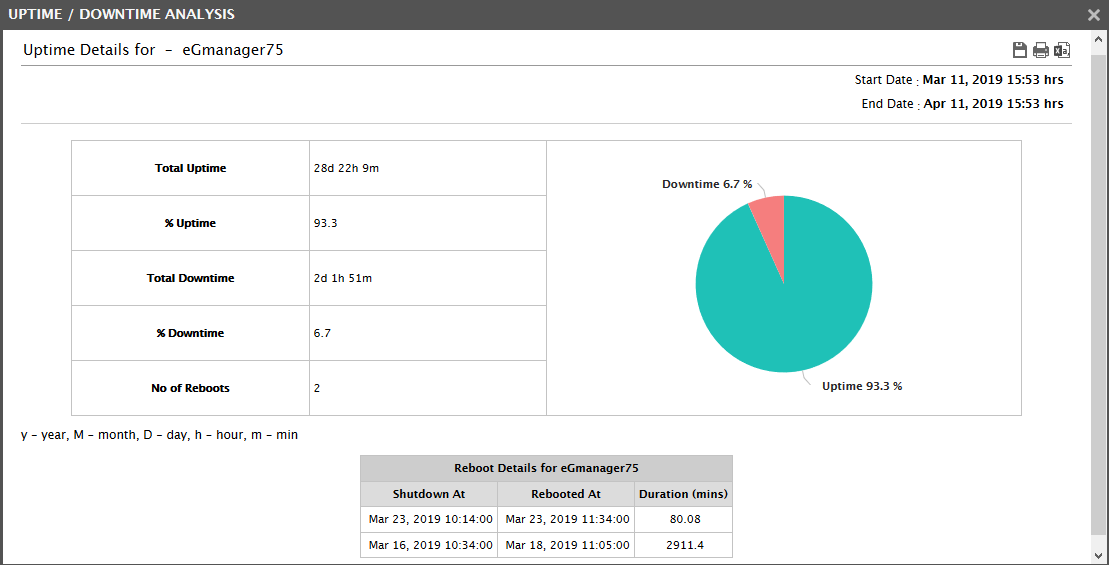
- Using the Uptime Details page, you can figure out how often a component was rebooted, and thus determine whether such reboots were scheduled or unexpected.
-
If the Report Type is Detail, and the option chosen from the Report Generation list is Foreground Generation - HTML, then clicking on the Run Report button will reveal Figure 6. For every component chosen, the Detail report reveals the total uptime, total downtime, percentage uptime, percentage downtime, and number of reboots. Components with high uptime/downtime and those that rebooted frequently can be instantly isolated using this report. Since the Show details flag is set to No by default for the Detail report, Figure 6 will not include a separate section providing reboot information. To view the reboot details of a component therefore, you will have to click on the
 icon under the DETAILS column corresponding to that component. This icon will appear only if that component was rebooted at least once during the specified Timeline.
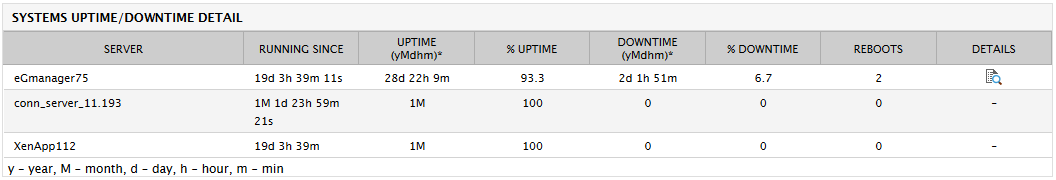
-
Figure 7 will then appear providing the reboot information in a separate window.
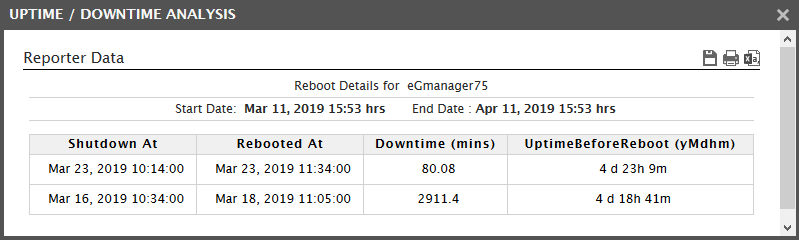
Figure 7 : The Reboot Details appearing in a separate window
-
If the Show Details flag had been set to Yes instead, then the reboot details available in Figure 8 be provided as part of the original report itself as depicted below.
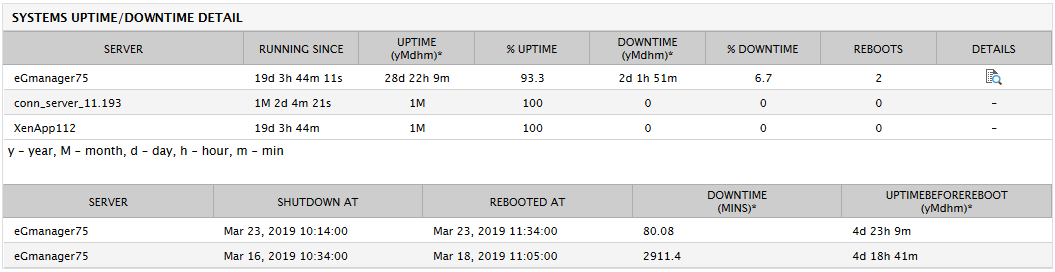
Figure 8 : The Uptime Data report displaying reboot details as well
- On the other hand, if the Background Save - PDF option is chosen from the Report Generation list, then clicking on the Run Report button will not generate the report and display it in this page for your benefit. Instead, a message indicating that the report is being processed in the background will appear. This will be accompanied by a link that will lead you to the page that lists all the reports that are being processed in the background, and their current status. If background report generation fails for a report, you can regenerate that report using this page, or can even delete that report if need be. On the other hand, if background processing successfully completes for your report, then, you can view a PDF of the report by clicking on the
 icon in that page.