User Experience Assessment Report
To view the overall user experience on a web application that is being monitored and to historically assess the user experience, eG Enterprise offers the User Experience Assessment report. By generating this report, administrators can obtain a summary of user experience in an easily understandable format, figure out the user experience and identify the web application that generated the maximum traffic (desktop or mobile or tablet). Recommendations are offered based on the analysis in this report. Administrators can provide a consolidated analysis of user experience to the application teams to analyze the slow transactions and also to the top-level management.
To generate a User Experience Assessment report, do the following:
- Login to eG Reporter.
- Follow the menu sequence: REPORTS BY FUNCTION -> Domain-specific Reports -> Web Application Monitoring -> Real User Monitoring -> User Experience Assessment.
-
Figure 1 will then appear.
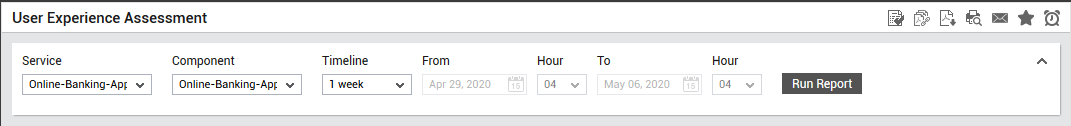
- Select the service for which the report is to be generated from the Service list box.
- Select a Component that is associated with the chosen Service and for which you wish to generate the report.
-
Provide a report Timeline. You can either select a fixed timeline such as 1 hour, 2 days, etc., or choose the Any option from the Timeline list, and then provide a From and To date/time for report generation.
Note:
For every user registered with the eG Enterprise system, the administrator can indicate the maximum timeline for which that user can generate a report. Once the maximum timeline is set for a user, then, whenever that user logs into eG Reporter and attempts to generate a report, the Timeline list box in the report page will display options according to the maximum timeline setting of that user. For instance, if a user can generate a report for a maximum period of 3 days only, then 3 days will be the highest option displayed in the Timeline list - i.e., 3 days will be the last option in the fixed Timeline list. Similarly, if the user chooses the Any option from the Timeline list and proceeds to provide a start date and end date for report generation using the From and To specifications, eG Enterprise will first check if the user's Timeline specification conforms to his/her maximum timeline setting. If not, report generation will fail. For instance, for a user who is allowed to generate reports spanning over a maximum period of 3 days only, the difference between the From and To dates should never be over 3 days. If it is, then, upon clicking the Run Report button a message box will appear, prompting the user to change the From and To specification.
-
In addition to the settings discussed above, this report comes with a set of default specifications. These settings are hidden by default. If you do not want to disturb these default settings, then you can proceed to generate the report by clicking the Run Report button soon after you pick a Measure. However, if you want to view and then alter these settings (if required), click on the
 icon. The default settings will then appear in the MORE OPTIONS drop down window (see Figure 2). The steps below discuss each of these settings and how they can be customized.
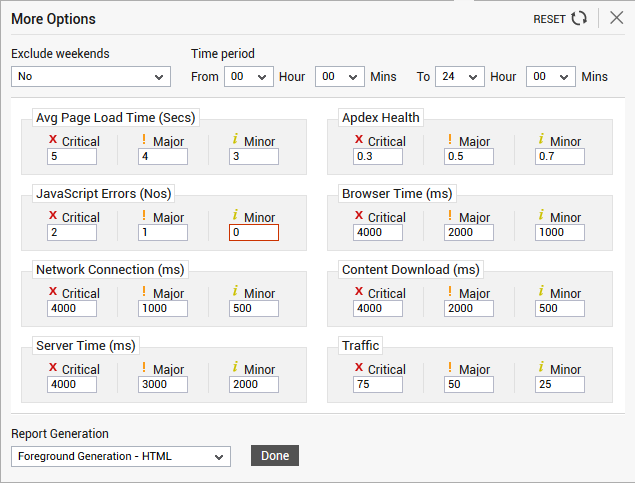
-
If the timeline specified for the report needs to exclude the data collected during the Weekends, then set Exclude weekends to Yes. If not, select No.
Note:
By default, the weekend constitutes Saturday and Sunday. To override this default setting, do the following:
- Edit the eg_report.ini file in the <EG_INSTALL_DIR>\manager\config directory.
- In the [RUM_REPOTRS] section of the file, the EXCLUDE_WEEKEND parameter is set to Saturday,Sunday by default. You can modify this by setting the EXCLUDE_WEEKEND parameter to a comma-separated list of other days of the week - say Friday, Saturday.
- Save the file after making the required changes.
- Next, specify the start time and end time for report generation against the Time period field.
-
By default, eG Enterprise has a few default criteria set (in terms of Critical / Major / Minor) based on which the user experience on a web site/web application is assessed. Though the report generated with the default criteria may be satisfactory for most of the administrators, administrators of a few web sites may want more flexibility in generating the report. To cater to the needs of such administrators, eG Enterprise offers administrators the flexibility to set different criteria values. Administrators can set their own values (in terms of Critical / Major / Minor) for the following criteria:
- Avg Page load Time
- Apdex Health
- JavaScript Errors
- Browser Time
- Network Connection
- Content Download
- Server Time
- Traffic
-
In large environments, reports generated using months of data can take a long time to complete. Administrators now have the option of generating reports on-line or in the background. When a report is scheduled for background generation, administrators can proceed with their other monitoring, diagnosis, and reporting tasks, while the eG manager is processing the report. This saves the administrator valuable time. To schedule background processing of a report, select the Background Save - PDF option from the Report Generation list. In this case, a Report Name text box will appear, where you would have to provide the name with which the report is to be saved in the background. To process reports in the foreground, select the Foreground Generation - HTML option from this list.
Note:
- The Report Generation list will appear only if the EnableBackgroundReport flag in the [BACKGROUND_PROCESS] section of the eg_report.ini file (in the [EG_INSTALL_DIR]\manager\config directory) is set to Yes.
- The default selection in the Report Generation list will change according to the Timeline specified for the report. If the Timeline set is greater than or equal to the number of days specified against the MinDurationForReport parameter in the [BACKGROUND_PROCESS] section of the eg_report.ini file, then the default selection in the Report Generation list will be Background. On the other hand, if the Timeline set for the report is lesser than the value of the MinDurationForReport parameter, then the default selection in the Report Generation list will be Foreground. This is because, the MinDurationForReport setting governs when reports are to be processed in the background. By default, this parameter is set to 2 weeks - this indicates that by default, reports with a timeline of 2 weeks and above will be processed in the background.
- Administrators are provided an option to reset the entire contents of the More Options drop down window and set their own values. To this effect, a RESET button is provided in the More Options drop down window. Clicking this button will reset the contents of the More Options window.
- Click the Done button if any changes were made to the More Options drop down window.
-
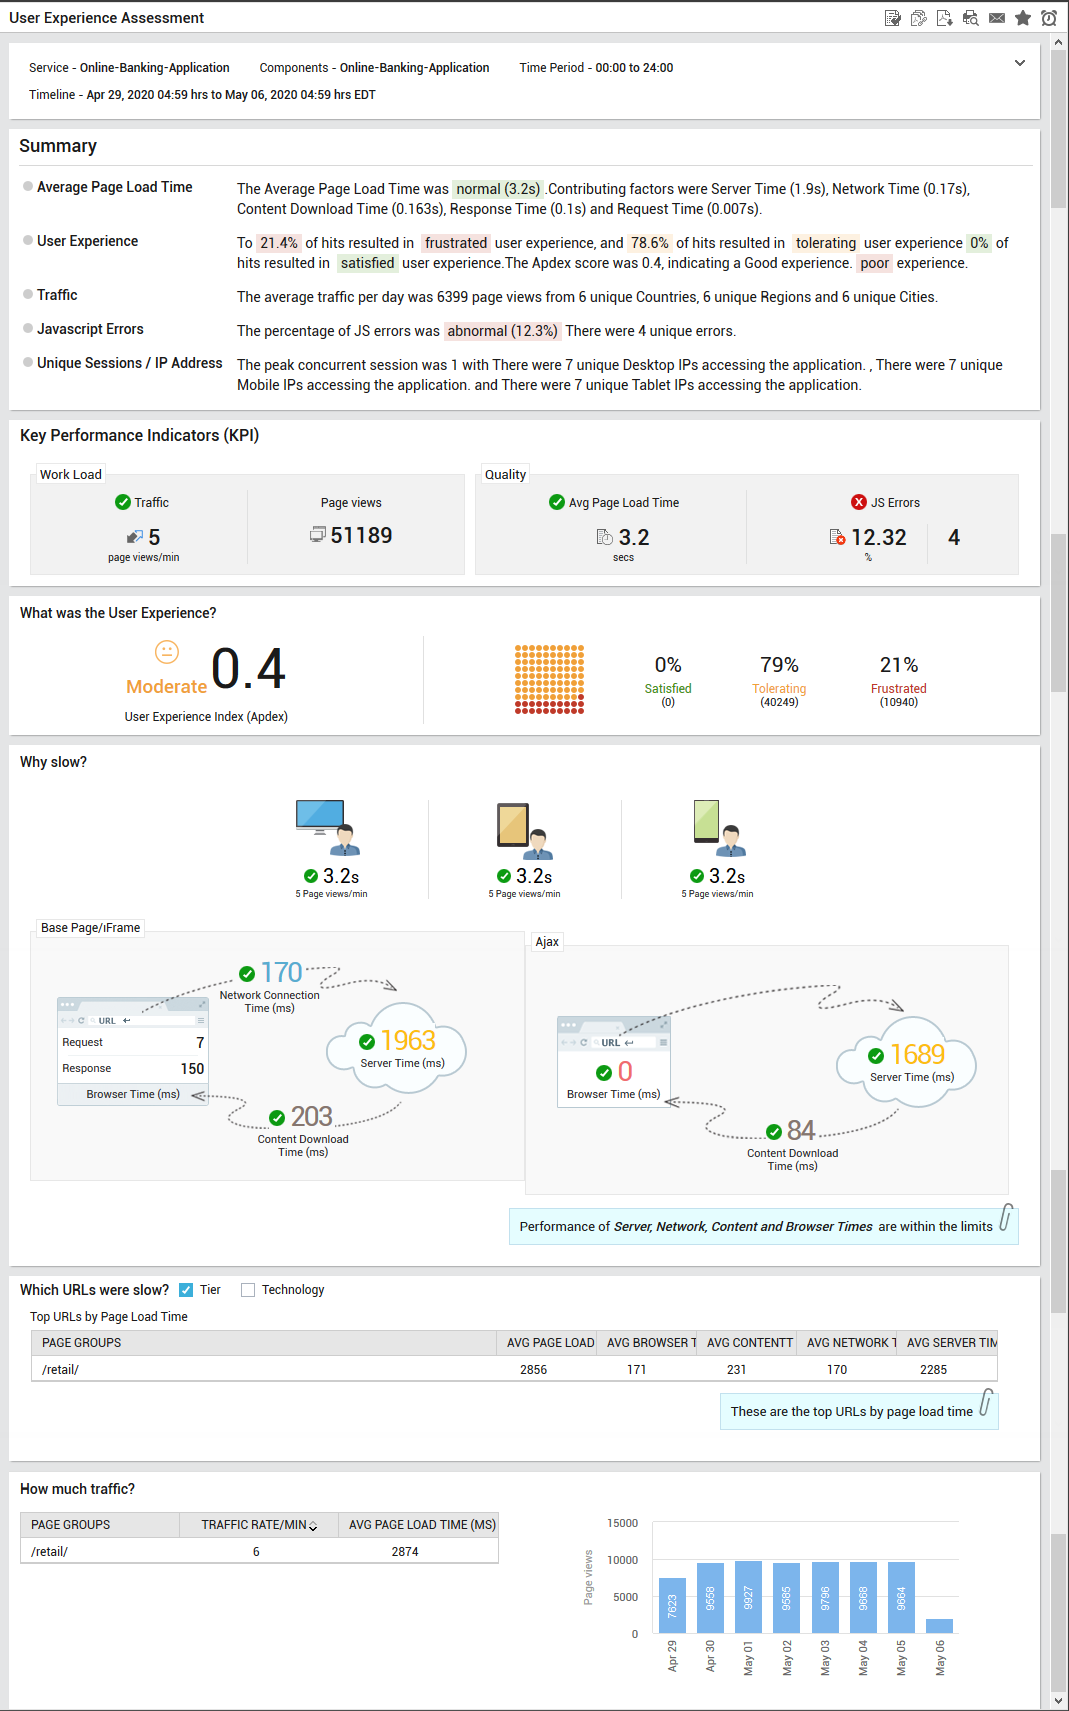
Finally, click the Run Report button to generate the report. Figure 3 will then appear.
-
The Summary section in Figure 3 helps administrators figure out the following:
- Whether/not the Avg Page Load Time was normal?
- What is the user experience on the web site/web application. What is the percentage of satisfied, tolerating and frustrated users accessing the web site/web application?
- How many page views are recorded per day for the target web site/web application? What is the split up of the page views based on geography?
- How many JavaScript errors were encountered by the users?
- How many unique user sessions/IP addresses were involved in accessing the target web site/web application?
- The Key Performance Indicators (KPI) section provides an at a glance views on the number of page views and the page views/min traffic rate. The average page load time and the number of javascript errors are also reported in this section.
- The What was the User Experience? section reveals the overall user experience to the web site/web application. A heat map chart plotted in this section reveals the percentage of satisfied, tolerating and frustrated users.
- The Why slow? section will help administrators figure out the user experience on each device (mobile/desktop/tablet). In the process, administrators can figure out the device that suffered the most. Also administrators are alerted to where exactly the user experience has suffered - whether is over the network connection? or server connection? or browser time? or content download time? A recommendation is also provided in this section which helps administrators identify the exact problem.
-
By default, the Tier check box is selection against the Which URLs were slow? section. The top URLs that were slow in terms of page load time are displayed in this section. If the Technology check box is chosen against this section, then Figure 4 will appear.
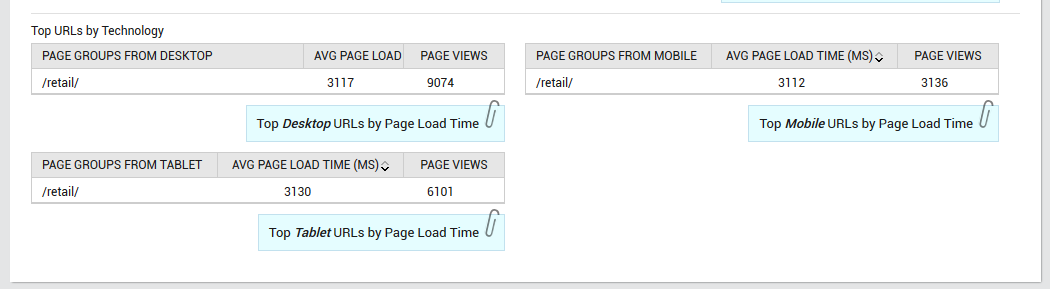
Figure 4 : The Top URLs by Technology
Using Figure 4, administrators can figure out the URLs that were slow to load when the web site/web application was accessed from different devices (desktop/mobile/tablet).
- The How much of Traffic? section reveals a bar graph for the chosen time period using which administrators can determine the page views on each day. The day on which the page views peaked can be easily determined from this bar graph.