VMs by Datastore Report
In a virtualized environment, a VM's operations may stall due to the unavailability, high latency, or abnormal usage of the datastore/virtual disks assigned to that VM. Since a datastore and/or a virtual disk can be shared by multiple VMs on a host, whenever users complaint of slowdowns while accessing their virtual applications, it would help to know which datastore/virtual disk has been assigned to the VMs running those virtual applications and how the datastore/virtual disk has been utilized by each VM. This knowledge will enable you to isolate over-utilized storage (i.e., datastore and virtual disks), the VMs responsible for their excessive usage, and the VMs affected by the same. The Datastores Details report provides you with this information.
Upon selection of one/all VMs on a virtual host, this report indicates which virtual disk and datastore has been assigned to the VMs, and how the VMs utilized the virtual disk and the datastore in the given timeline. This enables administrators to do the following:
- Quickly point to over-utilized or slow storage;
- Identify the VMs on a host that are using the storage excessively;
- Understand how this excessive usage impacts the performance of other VMs on the host that are sharing the same storage
To generate this report, do the following:
- Select the DataStores VM Details option by following the menu sequence: REPORTS BY FUNCTION -> Virtualization -> DataStores.
-
Figure 1 will then appear.
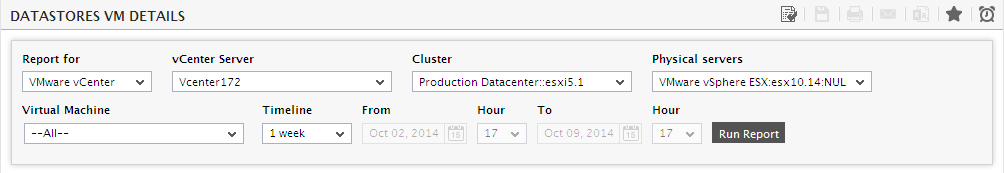
- Select VMware vCenter from the Report for list, and then pick the vCenter Server for which the report is to be generated.
- All clusters managed by the chosen vCenter will then populate the Cluster list. If the vSphere ESX server for which the report is to be generated is part of a particular cluster, select that cluster from this list. If you do not know which cluster the vSphere server belongs to, then, select the All option and proceed.
- If a particular Cluster is chosen, then the Physical Server list will include all vSphere ESX servers that are part of that cluster. On the other hand, if All is chosen from the Cluster list, then all the vSphere servers across clusters will be available for selection in the Physical Server list. Pick the server for which the report is to be generated.
- Next, from the list of Virtual Machines on the chosen Physical Server, select the VM for which the report is to be generated. To view the datastore details of all VMs on the chosen Physical Server, select the All option.
-
Then, specify the Timeline for the graph. You can either provide a fixed time line such as 1 hour, 2 days, etc., or select the Any option from the list to provide a From and To date/time for report generation.
Note:
For every user registered with the eG Enterprise system, the administrator can indicate the maximum timeline for which that user can generate a report. Once the maximum timeline is set for a user, then, whenever that user logs into eG Reporter and attempts to generate a report, the Timeline list box in the report page will display options according to the maximum timeline setting of that user. For instance, if a user can generate a report for a maximum period of 3 days only, then 3 days will be the highest option displayed in the Timeline list - i.e., 3 days will be the last option in the fixed Timeline list. Similarly, if the user chooses the Any option from the Timeline list and proceeds to provide a start date and end date for report generation using the From and To specifications, eG Enterprise will first check if the user's Timeline specification conforms to his/her maximum timeline setting. If not, report generation will fail. For instance, for a user who is allowed to generate reports spanning over a maximum period of 3 days only, the difference between the From and To dates should never be over 3 days. If it is, then, upon clicking the Run Report button a message box will appear, prompting the user to change the From and To specification.
-
In addition to the settings discussed above, this report comes with a set of default specifications. These settings are hidden by default. If you do not want to disturb these default settings, then you can proceed to generate the report by clicking the Run Report button soon after you pick a Virtual Machine. However, if you want to view and then alter these settings (if required), click on the
 button. The default settings will then appear in the MORE OPTIONS drop down window (see Figure 2). The steps below discuss each of these settings and how they can be customized.
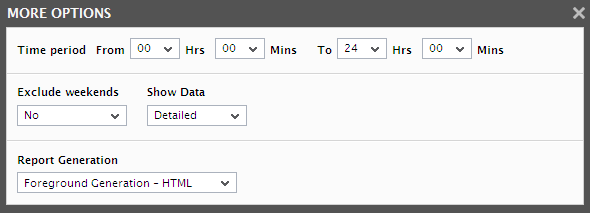
Figure 2 : The default settings for generating the DataStores VM Details report
-
The speed with which a report is generated depends primarily on the report Timeline. While a Timeline that varies between a couple of days to a week enables the eG Enterprise system to quickly retrieve the required data, timelines that span multiple weeks/months could slow-down the data retrieval and report generation process to a considerable extent, owing to the volume of data involved. In order to ensure quick and easy access to reports, eG Enterprise provides you the option of enabling data retrieval from the Trend information in the database, instead of the Detailed test information that is used by default for report generation. The Detailed test information based comprises of multiple measurement records for a test - one or more each for every test execution. Whereas, the Trend information includes only hourly, daily, and monthly summary computations for a test performed on a continuous basis. For instance, during a period of 1 hour, a test that runs every 5 minutes inserts atleast 12 records into the Detailed test information base. On the other hand, the Trend information base would consist of only 1 record for the same 1 hour period. Fewer the number of records, query execution becomes much quicker, and data retrieval faster. To use the trend data for report generation, you will have to select the Trend option from the Show Data field in Figure 1. By default, the Detailed option is selected in Figure 1 indicating that the report data is retrieved from the detailed test information in the database. If need be, you can also ensure that all reports always use the Detailed test tables alone by hiding the Show Data field from the reporter interface. To achieve this, do the following:
- Login to the eG administrative interface as 'admin'.
- Follow the menu sequence, Configure -> Settings. In the SETTINGS page that appears, select the General node under the Manager Settings node of the Settings tree.
-
From the MANAGER SETTINGS page that then appears, if you set the Compute average/sum of metrics while trending flag to No, then the Show Data field will not appear in the reporter interface; this denies users access to the Trend option, and thus ensures that reports are always generated using the Detailed tables.
Note:
- A Trend report will not include the data for the current day since trend data is only computed at the end of the day.
- If the Trend option is chosen, the time period of the report should be greater than 1 day.
-
The usage of Detailed test tables for generating reports, especially those that span weeks, increases the stress on the eG database, thus resulting in undue delays in report generation. In order to ensure that the database is not choked by such voluminous data requests, you can configure eG Enterprise to automatically "force" the use of the Trend option if the Timeline of a report exceeds a pre-configured duration. To specify this time boundary, do the following:
- Edit the eg_report.ini file in the <EG_INSTALL_DIR>\manager\config directory.
- In the [MISC] section of the file, you will find a DetailedTime parameter.
- Specify the duration (in days) beyond which Detailed reports cannot be generated, against the DetailedTime parameter, and save the eg_report.ini file.
- For instance, to make sure that Detailed reports are disallowed for a Timeline of over 2 weeks, set the DetailedTime parameter to 14 and save the file.
- Say, subsequently, you attempt to generate a Detailed report for a FixedTimeline of 3 weeks (which is greater than the 14-day limit set in our example). The instant you select the 3 weeks option from the Fixed list box, the Detailed option gets automatically disabled, and the Trend option gets enabled. Similarly, if you specify an AnyTimeline that runs over 14 days, then, upon clicking the Run Report button to generate the report, a message box appears (see Figure 8) informing you that only the Trend option is permitted.
- To proceed with the Trend report generation, click the ok button in the message box. To terminate Trend report generation, click the Cancel button.
-
If the timeline specified for the report needs to exclude the data collected during the Weekends, then set Exclude weekends to Yes. If not, select No.
Note:
By default, the weekend constitutes Saturday and Sunday. To override this default setting, do the following:
- Edit the eg_report.ini file in the <EG_INSTALL_DIR>\manager\config directory.
- In the [virtual_datastore] section of the file, the exclude_weekendparameter is set to Saturday,Sunday by default. You can modify this by setting the exclude_weekend parameter to a comma-separated list of other days of the week - say Friday,Saturday.
- Save the file after making the required changes.
- Next, indicate the report Timeperiod.
-
In large environments, reports generated using months of data can take a long time to complete. Administrators now have the option of generating reports on-line or in the background. When a report is scheduled for background generation, administrators can proceed with their other monitoring, diagnosis, and reporting tasks, while the eG manager is processing the report. This saves the administrator valuable time. To schedule background processing of a report, you can either select the Background Save - PDF option or the Background Save - CSV option from the Report Generation list. In this case, a Report Name text box will appear, where you would have to provide the name with which the report is to be saved in the background. To process reports in the foreground, select the Foreground Generation - HTML option from this list.
Note:
- The Report Generation list will appear only if the EnableBackgroundReport flag in the [BACKGROUND_PROCESS] section of the eg_report.ini file (in the {EG_INSTALL_DIR}\manager\config directory) is set to Yes.
- The default selection in the Report Generation list will change according to the Timeline specified for the report. If the Timeline set is greater than or equal to the number of days specified against the MinDurationForReport parameter in the [BACKGROUND_PROCESS] section of the eg_report.ini file, then the default selection in the Report Generation list will be Background Save - PDF. On the other hand, if the Timeline set for the report is lesser than the value of the MinDurationForReport parameter, then the default selection in the Report Generation list will be Foreground. This is because, the MinDurationForReport setting governs when reports are to be processed in the background. By default, this parameter is set to 2 weeks - this indicates that by default, reports with a timeline of 2 weeks and above will be processed in the background.
-
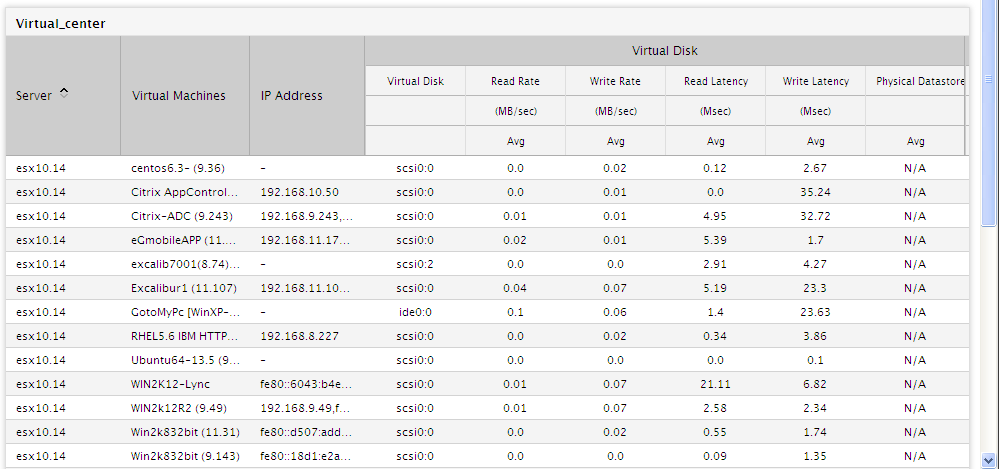
Finally, click the Run Report button. Figure 3 will then appear.
-
If the All option had been chosen from the Virtual Machine list, Figure 3 will list all the VMs on the selected Physical Server. For each VM, the report will reveal the name of the virtual disk and physical datastore that has been assigned to that VM. The space usage, I/O activity, and read/write latency experienced by that virtual disk and physical datastore will also be displayed in the report. With the help of this report, you can determine the following:
- Which virtual disks and physical datastores have been utilized excessively?
- Which virtual disks and physical datastores have been utilizing high latencies?
- Which VMs on the host are using these problematic virtual disks and phystical datastores?
- Which VMs are responsible for the abnormal space usage on a virtual disk?
- Which VMs are affected by the abnormal space usage on an assigned virtual disk/physical datastore?
- Clicking on any measure value in this report will lead you to a measure graph revealing the variations in that measure during the last hour.