Virtual Machines - Idle VMs Report
In a virtual environment, administrators often need to figure out if the provisioned virtual machines are used by the user appropriately. If a virtual machine is not used by the users, the resources held by that virtual machine will remain wasted! Therefore, administrators need to identify the virtual machines that are not in use for a long time and release the resources held by the virtual machines. This may help administrators in figuring out the virtual machines that are idle and right-size the environment accordingly. The Idle VMs report helps administrators identify the virtual machines that remained idle for a chosen time period. This way, the resources in the virtual environment can be put to use in a more productive manner.
To generate the report, do the following:
- Follow the menu sequence: REPORTS BY FUNCTION -> Domain-specific Reports -> Virtualization -> Virtual Machines -> Idle VMs.
-
Figure 1 will then appear. Pick a criterion for analysis from the Analyze by list. Using this report, you can analyze the VMs that are idle on the servers that are part of a segment, service, or a zone. The options provided by the Analyze by list box are discussed hereunder:
- Component: Select this option to choose the component(s) from across all the managed components in the environment.
- Service: Select this option if the components for which a report is to be generated are involved in the delivery of a business service. Then, select a Service.
- Segment: Choose this option if the components for which this report is to be generated are part of a segment. Then, pick a Segment for analysis.
-
Zone: Pick this option if the components chosen are part of a zone. Then, choose a Zone. Also, indicate whether the components within the sub-zones of the chosen zone are also to be considered for report generation, by selecting an option from the Include Subzone list.
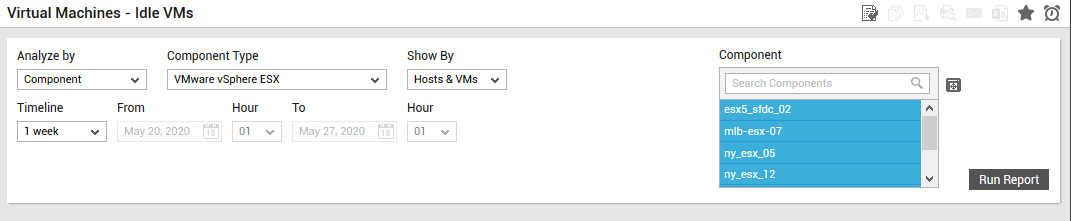
Figure 1 : Selecting the criteria for the Virtual Machines - Idle VMs report
- Select the Component Type for which you wish to analyze the sizing of the VMs.
- The Component list will then be populated with the servers that match the Analyze By criteria specified earlier. From this list, select the components for which the report is to be generated. If the Component list consists of too many components, then viewing all the components and selecting the ones you need for report generation could require endless scrolling. To avoid this, you can click the
 button next to the Component list. The Components pop up window will then appear using which you can view almost all the components in a single interface and select the ones for which the report is to be generated.
 - By default, the Hosts & VMs option is chosen from the Show By list indicating that the generated report will display the host or component associated with the virtual machine. However, if you wish to generate this report for the virtual machines in your environment irrespective of the hosts, then, you can pick the Only VMs option from this list.
-
Then, specify the Timeline for which the report is to be generated. You can either provide a fixed time line such as 1 hour, 2 days, etc., or select the Any option from the list to provide a From and To date/time for report generation.
Note:
For every user registered with the eG Enterprise system, the administrator can indicate the maximum timeline for which that user can generate a report. Once the maximum timeline is set for a user, then, whenever that user logs into eG Reporter and attempts to generate a report, the Timeline list box in the report page will display options according to the maximum timeline setting of that user. For instance, if a user can generate a report for a maximum period of 3 days only, then 3 days will be the highest option displayed in the Timeline list - i.e., 3 days will be the last option in the fixed Timeline list. Similarly, if the user chooses the Any option from the Timeline list and proceeds to provide a start date and end date for report generation using the From and To specifications, eG Enterprise will first check if the user's Timeline specification conforms to his/her maximum timeline setting. If not, report generation will fail. For instance, for a user who is allowed to generate reports spanning over a maximum period of 3 days only, the difference between the From and To dates should never be over 3 days. If it is, then, upon clicking the Run Report button a message box will appear, prompting the user to change the From and To specification.
-
In addition to the settings discussed above, this report comes with a set of default specifications. These settings are hidden by default. If you do not want to disturb these default settings, then you can proceed to generate the report by clicking the Run Report button soon after you pick a Component. However, if you want to view and then alter these settings (if required), click on the
 button. The default settings will then appear in the MORE OPTIONS drop down window (see Figure 2). The steps below discuss each of these settings and how they can be customized.
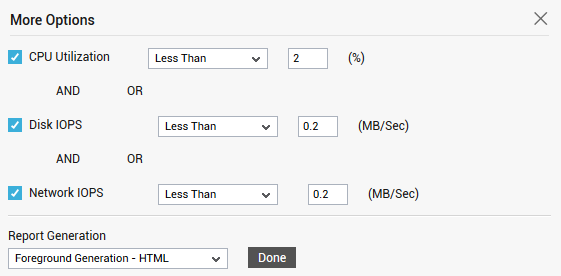
- By default, a virtual machine is considered as 'idle' if the CPU utilization, disk IOPS and Network IOPs are less than a certain criteria. To this effect, the check boxes available beneath the CPU Utilization, Disk IOPS and Network IOPS are checked and a default value is specified in the list box adjacent to the criteria. By default, a virtual machine will be considered as idle if the CPU utilization is less than 2%, Disk IOPS is less than 0.2 MB/sec and Network IOPS is less than 0.2 MB/sec. However, administrators can set their own criteria to deem a virtual machine as 'idle' by modifying the criteria.
-
eG Enterprise allows users to generate desired reports for a specific time period. In large environments, while generating reports for long time periods, say a few weeks to months, report generation was found to slow down, owing to the large volume of data being processed. If users needed to generate many such reports quickly, the slowdown compelled them to generate these reports one after another, thus affecting the speed of their operations, and consequently, their productivity. eG Enterprise now includes a background processing feature that will enable users to process multiple reports, spanning long time periods in the background, while allowing them the bandwidth to generate short-term reports in the foreground. This way, users can generate multiple reports with little-to-no loss of time. To schedule background processing of a report, select the Background Save - PDF option from the Report Generation list. In this case, a Report Name text box will appear, where you would have to provide the name with which the report is to be saved in the background. To process reports in the foreground, select the Foreground Generation - HTML option from this list.
Note:
- The Report Generation list will appear only if the EnableBackgroundReport flag in the [BACKGROUND_PROCESS] section of the eg_report.ini file (in the {EG_INSTALL_DIR}\manager\config directory) is set to Yes.
- The default selection in the Report Generation list will change according to the Timeline specified for the report. If the Timeline set is greater than or equal to the number of days specified against the MinDurationForReport parameter in the [BACKGROUND_PROCESS] section of the eg_report.ini file, then the default selection in the Report Generation list will be Background. On the other hand, if the Timeline set for the report is lesser than the value of the MinDurationForReport parameter, then the default selection in the Report Generation list will be Foreground. This is because, the MinDurationForReport setting governs when reports are to be processed in the background. By default, this parameter is set to 2 weeks - this indicates that by default, reports with a timeline of 2 weeks and above will be processed in the background.
-
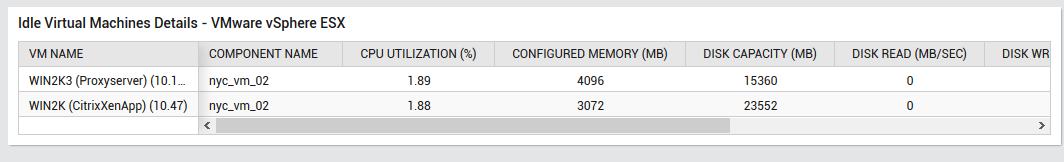
Finally, click the Run Report button. Figure 3 will then appear.
-
The generated report as shown in Figure 3 lists the virtual machines that were idle during the chosen time period. The hosts to which the virtual machines are associated with can also be ascertained. For each virtual machine, the CPU utilization, configured memory, disk capacity, disk read/write rate and network IOPS can be viewed in the report. You can sort this report based on any column by just clicking on the column label.
-
If Only VMs option is chosen from the Show By list, then Figure 4 will appear. Here, the COMPONENT NAME column will not appear indicating that the hosts associated with the VMs will not be listed in the generated report.
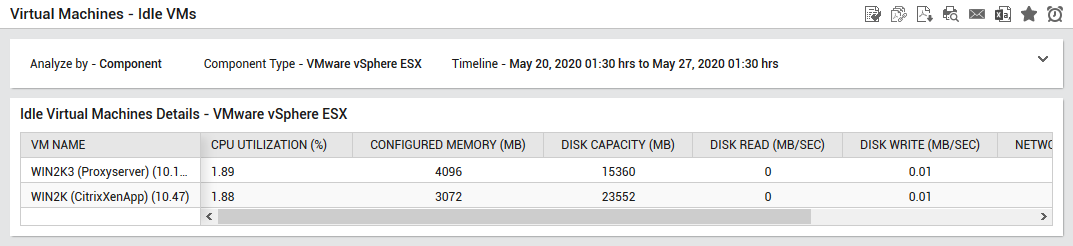
Figure 4 : The report that is generated when Only VMs option is chosen from the Show By list