Virtual Machines - VM Changes Report
Large virtualized environments often consist of too many VMs hosted on the virtual server. Apart from monitoring these VMs, monitoring the addition, migration and removal of VMs from the virtual server poses a major problem for the administrators. Using the VM Changes report, you can easily identify the VMs that are currently added to and removed from the virtual server. In addition to this, administrators can figure out those VMs that were migrated within the resource pools of the virtual server or outside the virtual server.
Essential Pre-requisites for generating the VM Changes report:
- In order to generate the VM Changes report, ensure that the VM Movement test is enabled. By default, this test is disabled. To enable the test, go to the enable / disable tests page in the eG admin interface using the menu sequence: Agents -> Tests -> Enable/Disable, pick the component-type for which these tests are to be enabled as the Component type, set Performance as the Test type, choose the tests from the disabled tests list, and click on the >> button to move the tests to the enabled tests list. Finally, click the Update button.
- Once the test is enabled, ensure that the test is up and running i.e., collecting the required metrics.
To generate the VM Changes report, do the following:
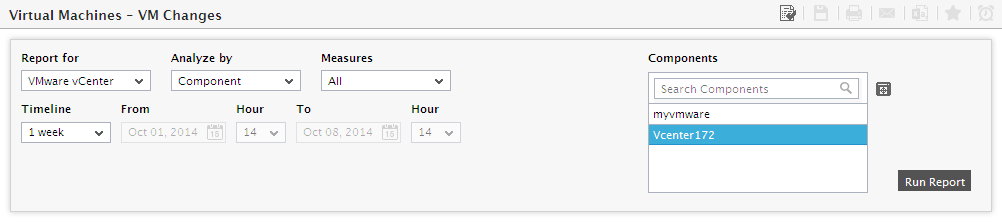
- Follow the menu sequence: REPORTS BY FUNCTION -> Virtualization -> Virtual Machines -> VM Changes.
-
Figure 1 will then appear. By default, the Report for list will display VMware vCenter as its selection.
-
Next, from the Components list, select the vCenter server(s) for which this report is to be generated. By default, all the managed vCenter servers in your environment will be listed here. This is because, the default selection from the Analyze by list is Component. You can however narrow your search by opting to view only those vCenter servers that are part of a service/segment/zone in the VMware vCenter list. For this, select the Zone, Service, or Segment, option from the Analyze By field:
- Selecting the Zone option will allow you to select the desired zone from the Zone list box. To include the vCenter servers within a specific subzone also in the VMware vCenter list, set the Include subzone flag to Yes.
- In the same way, to make the vCenter servers that are part of a particular segment or service available for selection in the VMware vCenterlist, select Service or Segment from the Analyze By list box. Then, select the desired service or segment from the Service or Segment list.
- If the Components list consists of too many vCenter servers, then viewing all the components and selecting the ones you need for report generation could require endless scrolling. To avoid this, you can click the
 button next to the Components list. The COMPONENTS pop up window will then appear using which you can view almost all the vCenter servers in a single interface and select the ones for which the report is to be generated.
 - Select an option from the Measures list for which the report is to be generated. By default, All option is chosen from this list indicating that this report will be generated for all the VMs that are added, removed and migrated from the chosen vCenter components.
-
Specify the report Timeline. You can either provide a fixed time line such as 1 hour, 2 days, etc., or select the Any option from the list to provide a From and To date/time for report generation.
Note:
For every user registered with the eG Enterprise system, the administrator can indicate the maximum timeline for which that user can generate a report. Once the maximum timeline is set for a user, then, whenever that user logs into eG Reporter and attempts to generate a report, the Timeline list box in the report page will display options according to the maximum timeline setting of that user. For instance, if a user can generate a report for a maximum period of 3 days only, then 3 days will be the highest option displayed in the Timeline list - i.e., 3 days will be the last option in the fixed Timeline list. Similarly, if the user chooses the Any option from the Timeline list and proceeds to provide a start date and end date for report generation using the From and To specifications, eG Enterprise will first check if the user's Timeline specification conforms to his/her maximum timeline setting. If not, report generation will fail. For instance, for a user who is allowed to generate reports spanning over a maximum period of 3 days only, the difference between the From and To dates should never be over 3 days. If it is, then, upon clicking the Run Report button a message box will appear, prompting the user to change the From and To specification.
-
In addition to the settings discussed above, this report comes with a set of default specifications. These settings are hidden by default. If you do not want to disturb these default settings, then you can proceed to generate the report by clicking the Run Report button soon after you pick an option from the Components list. However, if you want to view and then alter these settings (if required), click on the
 icon. The default settings will then appear in the MORE OPTIONS drop down window (see ). The steps below discuss each of these settings and how they can be customized.
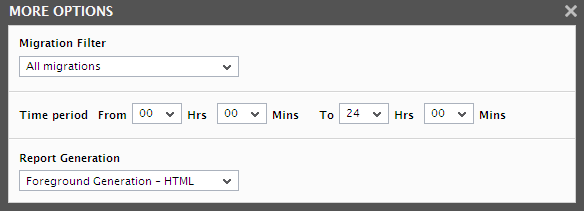
Figure 2 : The default settings for generating the VM changes report
- The Migration Filter list box will appear only when either the All or Migrated VMs option is chosen from the Measures list. By default, All migrations option is chosen from this list box. If you wish to generate the report for those VMs that have migrated across clusters alone, select the Migrations across cluster option from this list.
- Next, specify the start time and end time for report generation against the Time period field.
-
If the timeline specified for the report needs to exclude the data collected during the Weekends, then set Exclude weekends to Yes. If not, select No.
Note:
By default, the weekend constitutes Saturday and Sunday. To override this default setting, do the following:
- Edit the eg_report.ini file in the <EG_INSTALL_DIR>\manager\config directory.
- In the [measure_group] section of the file, the exclude_weekend parameter is set to Saturday,Sunday by default. You can modify this by setting the exclude_weekend parameter to a comma-separated list of other days of the week - say Friday,Saturday.
- Save the file after making the required changes.
-
In large environments, reports generated using months of data can take a long time to complete. Administrators now have the option of generating reports on-line or in the background. When a report is scheduled for background generation, administrators can proceed with their other monitoring, diagnosis, and reporting tasks, while the eG manager is processing the report. This saves the administrator valuable time. To schedule background processing of a report, you can either select the Background Save - PDF option or the Background Save - CSV option from the Report Generation list. In this case, a Report Name text box will appear, where you would have to provide the name with which the report is to be saved in the background. To process reports in the foreground, select the Foreground Generation - HTML option from this list.
Note:
- The Report Generation list will appear only if the EnableBackgroundReport flag in the [BACKGROUND_PROCESS] section of the eg_report.ini file (in the {EG_INSTALL_DIR}\manager\config directory) is set to Yes.
- The default selection in the Report Generation list will change according to the Timeline specified for the report. If the Timeline set is greater than or equal to the number of days specified against the MinDurationForReport parameter in the [BACKGROUND_PROCESS] section of the eg_report.ini file, then the default selection in the Report Generation list will be Background Save - PDF. On the other hand, if the Timeline set for the report is lesser than the value of the MinDurationForReport parameter, then the default selection in the Report Generation list will be Foreground. This is because, the MinDurationForReport setting governs when reports are to be processed in the background. By default, this parameter is set to 2 weeks - this indicates that by default, reports with a timeline of 2 weeks and above will be processed in the background.
-
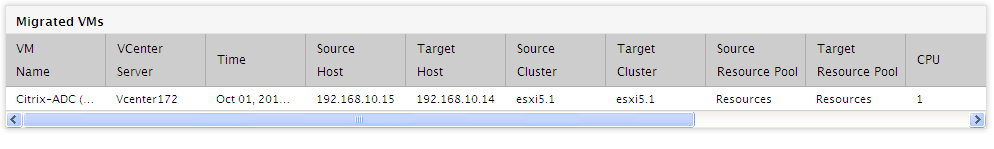
Finally, click the Run Report button. Figure 3 will now appear.
-
Figure 3 shows a tabular VM changes report for a chosen vCenter server. If All option is chosen from the Measures list and the Foreground Generation –HTML option is chosen from the Report Generation list, then the report consists of the following sections:
- Added VMs – This section will list out all the VMs that are currently added to the vCenter server and the exact target i.e., the host/resource pool/cluster to which the VMs were added can be identified. In addition, the resource allocation to the VMs can also be identified using this report.
- Migrated VMs – This section helps you to identify which are the VMs that are migrated from a source host/cluster/resource pool to the target host/cluster/resource pool.
- Removed VMs – This section lists all the VMs that are removed from the vCenter server and the source from which the VMs have been removed i.e., the host/cluster/resource pool from which the VMs were removed can be identified.
If Added VMs option is chosen from the Measures list and the Foreground Generation –HTML option is chosen from the Report Generation list, then the generated report will display only the Added VMs section. Likewise this report can be generated for the migrated VMs and the removed VMs by choosing the appropriate option from the Measures list.