Virtual Machines - VM Sprawl Report
Large virtualized environments are typically characterized by a multitude of virtual hosts, each hosting tens of virtual machines. Administrators need to periodically review the usage of these VMs in order to identify those VMs that have been utilized optimally and those that have been under-utilized. Since each VM, regardless of its powered-on state and user activity, consumes disk space and memory, the knowledge of unused/under-used VMs will enable administrators to decide whether/not to pull down such VMs in an effort to conserve valuable physical resources. The resources thus released may be used to support critical operations performed by other VMs or to avert slowdowns/performance degradations experienced by mission-critical applications executing on these VMs.
To provide administrators with insights into the state and usage of VMs across their virtualized environment, and to enable them to instantly identify unused VMs, eG Enterprise offers the VM Sprawl report. Using this report, administrators can figure out the following:
- How many VMs across the environment are in a powered-off state? Which ones are they?
- What percentage of time has a VM been in a powered-off state?
- Are there any powered-on VMs to which users have not logged in for a long time? If so, which ones are they?
- How much memory and disk space has each unused VM been configured with? Can the removal of these unused VMs improve the performance of other VMs and applications executing on them?
To generate this report, do the following:
-
Follow the menu sequence: REPORTS BY FUNCTION -> Domain-specific Reports -> Virtualization -> Virtual Machines -> VM Sprawl in the eG Reporter interface. Figure 1 then appears.
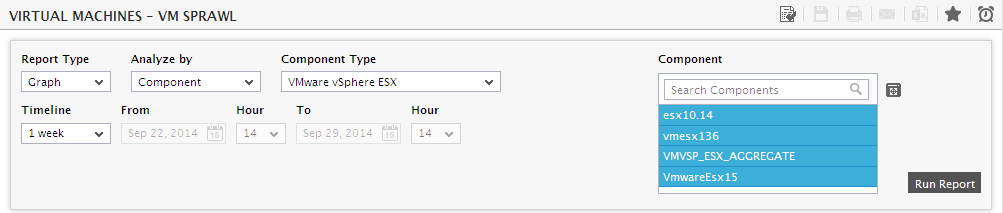
Figure 1 : Providing the specifications for the Virtual Machines - VM Sprawl report
- As shown in Figure 1, for a graphical report, select Graph as the Report Type. For a tabular report, select Data.
-
Then, select a criterion for analysis from the Analyze by list box. Using this report, you can analyze the performance of one/more independent virtualized components, or those that are part of a Zone. The options provided by the Analyze by list box are discussed hereunder:
- Component: Select this option to choose the component(s) from across all the managed components in the environment. For instance, for a report on the performance of all the managed ESX hosts in the environment, select VMware vSphere ESX from the Component Type list, select Component from the Analyze by list, and then select all the virtual hosts listed in the Component list.
-
Zone: Pick this option for a report on the performance of virtual components that are included in a zone. Then, choose a Zone. When a zone is picked, the Include Subzone flag is set to "Yes" by default, indicating that the virtual components within the Subzones of the chosen zone will also be considered for report generation. To exclude Subzones from the scope of your report, set this flag to "No". The Component Types list will then be populated with the virtual component types that are part of the chosen zone (and Subzone, if Include Subzone is set to "Yes"). Selecting a type from this list will populate the Components list with all components of that type, which are present in the selected zone. Select the required components from this list.
Note:
By default, the Component Types that are supported by this report are specified in the eg_report.ini file available in the [EG_INSTALL_DIR]\manager\config directory. To extend support to a new virtual component type, edit the eg_report.ini file, and append the internal name of the new component-type to the comma-separated list of types that pre-exists against the Components parameter in the [VM_SPRAWL] section of the file. For example, if an IBM pSeries Component Type has to be included in the eg_report.ini file, then include pSeries_server (internal name of the IBM pseries) to the comma-separated list of Components as indicated below:
Components=Oracle_vm_server,VMWare_VDI_Box,Xen_VDI_Box,HyperV_VDI_Box,Redhat_linux_hpv,Redhat_linux_vdi,Oracle_vdi_VirtualBox,Vmware_esx_server,VmEsx_i_server,Xen_virtual_server,Hyperv_server,Vmware_vdi_server,VmVdi_i_server,Xen_desktop_server,HyperV_VDI_server,pSeries_server,KVM_server,KVM_vdi_server
- If the Component list consists of too many components, then viewing all the components and selecting the ones you need for report generation could require endless scrolling. To avoid this, you can click the
 button next to the Component list. The COMPONENTS pop up window will then appear using which you can view almost all the components in a single interface and select the ones for which the report is to be generated.
 -
Then, specify the Timeline for the graph. You can either provide a fixed time line such as 1 hour, 2 days, etc., or select the Any option from the list to provide a From and To date/time for report generation.
Note:
For every user registered with the eG Enterprise system, the administrator can indicate the maximum timeline for which that user can generate a report. Once the maximum timeline is set for a user, then, whenever that user logs into eG Reporter and attempts to generate a report, the Timeline list box in the report page will display options according to the maximum timeline setting of that user. For instance, if a user can generate a report for a maximum period of 3 days only, then 3 days will be the highest option displayed in the Timeline list - i.e., 3 days will be the last option in the fixed Timeline list. Similarly, if the user chooses the Any option from the Timeline list and proceeds to provide a start date and end date for report generation using the From and To specifications, eG Enterprise will first check if the user's Timeline specification conforms to his/her maximum timeline setting. If not, report generation will fail. For instance, for a user who is allowed to generate reports spanning over a maximum period of 3 days only, the difference between the From and To dates should never be over 3 days. If it is, then, upon clicking the Run Report button a message box will appear, prompting the user to change the From and To specification.
-
In addition to the settings discussed above, this report comes with a set of default specifications. These settings are hidden by default. If you do not want to disturb these default settings, then you can proceed to generate the report by clicking the Run Report button soon after you pick one/more components from the Components list. However, if you want to view and then alter these settings (if required), click on the
 button. The default settings will then appear in the MORE OPTIONS drop down window (see Figure 3). The steps below discuss each of these settings and how they can be customized.
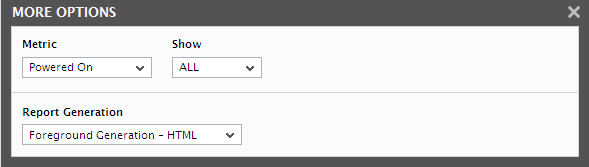
Figure 2 : The default settings for generating the VM Sprawl report
-
Select one of the following options from the Metric drop down list.
- For ESX hosts in the environment, the default selection from the Metric drop-down is Powered On.
- For VDI environments, the Metric drop-down will provide an additional Powered On With User option.
-
Then, select a convenient show option from the Show drop list.
Note:
The Show drop down list appears only when a graphical report is to be generated. The selection from this list governs the maximum number of VMs to be displayed in the bar graph. The default options of the Show list are: Top-25, Top-50, All, Last-25, Last-50. This default setting is governed by the ShowTop parameter in the [VM_SPRAWL] section of the eg_report.ini file (in the [EG_INSTALL_DIR]\manager\config directory). By default, this ShowTop parameter is set to 50. To view bar graphs for a more or less number of VMs, you may want to change this value. For example, if you set ShowTop to 100, then, the Show drop-down list in the report page will provide administrators with the following options: Top-100, Top-50, All, Last-100, and Last-50.
-
eG Enterprise allows users to generate desired reports for a specific time period. In large environments, while generating reports for long time periods, say a few weeks to months, report generation was found to slow down, owing to the large volume of data being processed. If users needed to generate many such reports quickly, the slowdown compelled them to generate these reports one after another, thus affecting the speed of their operations, and consequently, their productivity. eG Enterprise now includes a background processing feature that will enable users to process multiple reports, spanning long time periods in the background, while allowing them the bandwidth to generate short-term reports in the foreground. This way, users can generate multiple reports with little-to-no loss of time. To schedule background processing of a report, select the Background Save - PDF option from the Report Generation list. In this case, a Report Name text box will appear, where you would have to provide the name with which the report is to be saved in the background. To process reports in the foreground, select the Foreground Generation - HTML option from this list.
Note:
- The Report Generation list will appear only if the EnableBackgroundReport flag in the [BACKGROUND_PROCESS] section of the eg_report.ini file (in the [EG_INSTALL_DIR]\manager\config directory) is set to Yes.
- The default selection in the Report Generation list will change according to the Timeline specified for the report. If the Timeline set is greater than or equal to the number of days specified against the MinDurationForReport parameter in the [BACKGROUND_PROCESS] section of the eg_report.ini file, then the default selection in the Report Generation list will be Background. On the other hand, if the Timeline set for the report is lesser than the value of the MinDurationForReport parameter, then the default selection in the Report Generation list will be Foreground. This is because; the MinDurationForReport setting governs, when reports are to be processed in the background. By default, this parameter is set to 2 weeks - this indicates that by default, reports with a timeline of 2 weeks and above will be processed in the background.
-
Finally, click the Run Report button to generate the report.
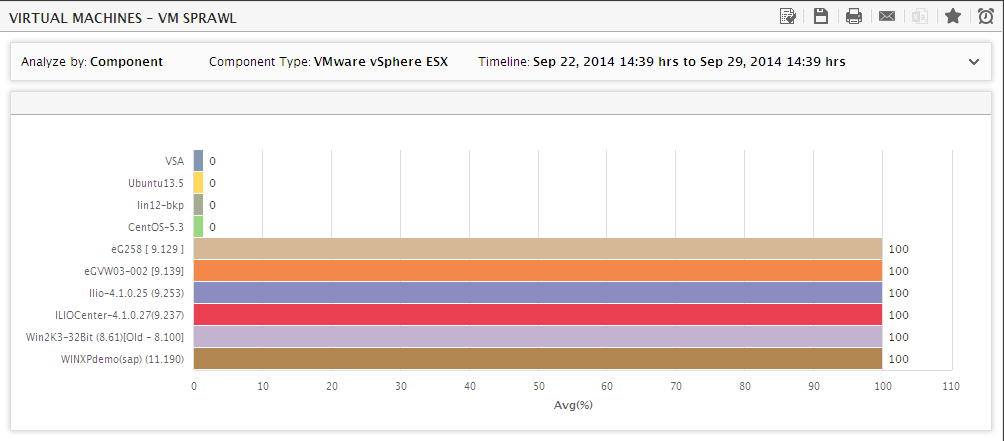
- For ESX virtual hosts environment, if the Report Type is Graph, you will view a report comprising a bar chart that reveals the VMs that have been configured on all the chosen virtual hosts, and the percentage of time (during the chosen Timeline) for which each VM has been in a powered-on state. Using this graph, you can instantly identify VMs that have remained in a powered-off state for a considerably long time; this way, VMs that have been unnecessarily eroding the allocated resources can be identified. Figure 3 shows the bar graph of this report.
-
For VDI environments, if the Display option chosen is Powered On With User, then, the resulting bar chart will reveal the percentage of time each VM in the environment has been in the powered on state with a user logged in. Using this graph, you can not only identify VMs that have been powered-off for a long time, but also powered-on VMs that have remained idle for a long time.
Note:
You can configure the bar colors of the bar chart in the report, by editing the eg_report.ini file in the {EG_INSTALL_DIR}\manager\config directory. The FusionColorForPowerOnPercent parameter in the [VM_SPRAWL] section of the file defines the default colors of the bars in your graph. You can change any of the color codes to change the color of a bar.
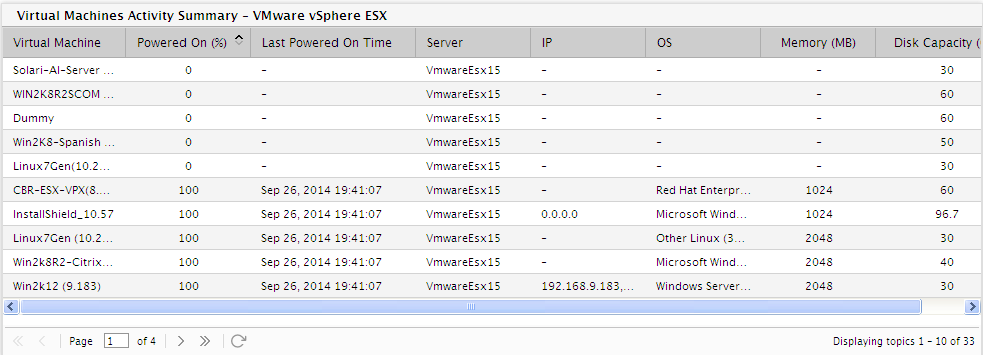
- Unlike a Graph report, a Data report does not graphically represent the measure data. Instead, the configured details are presented in a tabular format in the report.
- If the Report Type is Data, select a column name by which the report data is to be sorted from the Sort by list. Then, like in the case of a Graph report, specify a Timeline for which the report is to be generated and finally, click on the Run Report button.
-
For each VM configured on the chosen virtual components, the data report will display the percentage of time for which that VM was in a powered-on state during the stated timeline (Refer Figure 4). In addition, the Last Powered On time of a VM is also revealed - this is nothing but the last time the eG agent checked the status of the VM and found that it was powered-on. Using this information, you can determine whether the VM was powered-on or off during the last measurement period. Also the measures such as Memory and Disk Capacity can also be viewed per VM, thus enabling you to assess how removal of unused VMs will impact the resource availability on the host.
-
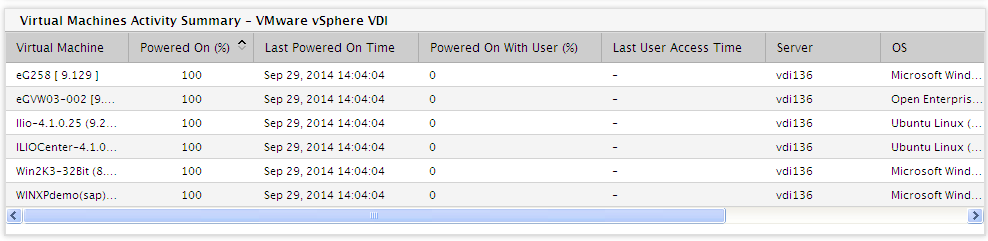
In case of VDI environments, the data report will additionally reveal the percentage of time for which each VM was powered-on with an active user session; this way, you can quickly identify powered-on VMs that have been idle for long time periods. Also, a Last User Access Time will be available for each VM, which will reveal the last time a user had logged into that VM - this is nothing but the last time the eG agent checked the state of the VM and found that it was powered on with a user session active on it. Figure 5 will reveal the data report for the VDI environments.
-
If the Background Save - PDF option is chosen from the Report Generation list, then clicking on the Run Report button will not generate the report and display it in this page for your benefit. Instead, a message indicating that the report is being processed in the background will appear. This will be accompanied by a link, which will lead you to the page that lists all the reports that are being processed in the background, and their current status. If background report generation fails for a report, you can regenerate that report using this page, or can even delete that report if need be. On the other hand, if background processing successfully completes for your report, then, you can view a PDF of the report by clicking on the
 icon in that page.
 Note:
- Before emailing reports, ensure that the SMTP mail host and eG Administrator mail ID are properly configured in the eG administrative interface (using the Alerts -> Mail Settings -> Server Settings option).
- When reports are sent by email, the body of the email will contain the reports so sent in HTML format. You can, if you so desire, send the report as an attachment by setting the SendMailAsAttachment flag to Yes (or True). This flag is available in the [MISC_ARGS] section of the eg_services.ini file (in the {EG_INSTALL_DIR}\manager\config directory).