Virtualization Manager - Overview Report
The Virtualization Manager report tracks the performance history of vCenter installations in the target environment, so that administrators are able to perform the following effectively:
- Determine how healthy the vCenter server as a whole has been over a broad period of time;
- Take a closer look at the overall performance of the critical components of vCenter - i.e., clusters and individual physical servers managed by vCenter - over time;
- Detect peculiar problem patterns, and analyze the root-cause of recurring performance issues.
Using the pointers provided by the report, administrators can answer the following questions quickly and precisely:
- Has the vCenter server been sized adequately, or did the server experience frequent resource inadequacies?
- How often during the designated period could a connection to vCenter not be established? What were the common reasons for this failure?
- On an average, how many physical servers were managed by a vCenter installation over time? Was any vCenter instance overloaded?
- Were any physical servers not responding to vCenter for a long period of time?
- Were any physical servers disconnected from vCenter during the given period?
- Were sufficient CPU and memory resources allocated to the physical server clusters configured on vCenter? Did the clusters experience any resource shortage at any point of time during the given period?
- Did the clusters use the allocated resources optimally, or were the clusters resource-intensive? To which vCenter/XenCenter server were resource-intensive clusters affiliated?
- What about the physical servers managed by vCenter? Were these servers sized properly?
- Did the physical servers consume the physical resources available to them excessively over time? Which vCenter instance was managing the resource-hungry physical servers?
- Did the network traffic to and from the physical servers increase/decrease with time?
- How many powered-on guests were on the physical servers during the stated period? Did this count change too frequently?
- During what times did vCenter Vmotion guests to a physical server, and when did it remove guests from a server? How did this movement impact server performance?
While this report is typically generated for pre-configured metrics, users can modify the configuration (if need be) by adding more metrics, removing one/more of the existing metrics, or by applying additional functions to the metrics.
To generate the Virtualization Manager report, do the following:
-
Select the Virtualization Manager option from the vCenter Reports node of the REPORTS BY FUNCTION tree in the eG Reporter interface.
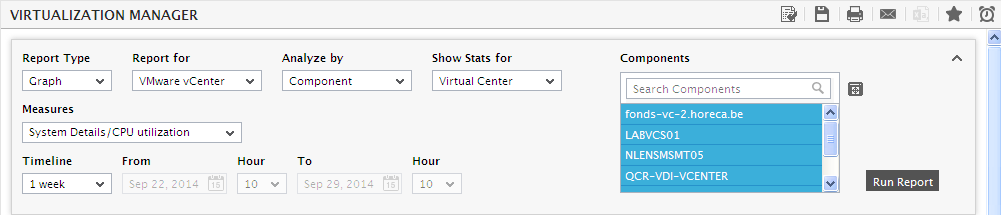
Figure 1 : Selecting the criteria for the Virtualization Manager report
- When Figure 1 appears, first, indicate the type of report to be generated by selecting an option from the Report Type field. To generate a graphical report, select the Graph option. To generate a report that displays desired metrics in a tabular format, select the Data option.
- Next, indicate which vCenter component the report is meant for - currently, reports can be generated for VMware vCenter only. Therefore, this option is chosen by default from the Report for list.
- If the vCenter(s) for which the report is to be generated is part of a zone, then select the Zone option from the Analyze by list, and then pick the Zone to which the vCenter server has been added. By default, the Zone list will include only the parent zones that contain vCenters. If you want to generate this report for vCenters that are included in sub-zones, then set the Include subzone flag to Yes. On the other hand, to generate this report for one/more independent VCenters, just select Component from the Analyze by list.
- The Components list will then be populated with the vCenters that match the Analyze by criteria specified earlier. From this list, select the vCenter server(s) for which the report is to be generated. If the Components list consists of too many components, then viewing all the components and selecting the ones you need for report generation could require endless scrolling. To avoid this, you can click the
 button next to the Components list. The COMPONENTS pop up window will then appear using which you can view almost all the components in a single interface and select the ones for which the report is to be generated.
 -
Using this report, you can analyze the performance of any of the following:
- The chosen vCenter server;
- The clusters configured on the chosen vCenter
- The physical servers managed by the selected vCenter server.
Accordingly, you can select theVirtual Center, Virtual Center Cluster, or Physical Servers option from the Show Stats for list.
-
The Measures list will be available only for a Graph report and not the Data report. Based on the option chosen from the Show Stats for list, the elements of the Measures list will change. For instance:
- If the option selected from the Show Stats for list is Virtual Center, then the Measures list will be populated with a default set of test/measurepairs that reveal the resource usage by the chosen vCenters, availability of the vCenters over the network, and the health of the interactions between the vCenter and the physical servers it manages;
- If the option selected from the Show Stats for list is Virtual Center Cluster, then the Measures list will be populated with a default set of test/measure pairs that reveal the resource allocations and resource usage by the clusters configured on the chosen vCenters;
- If the option selected from the Show Stats for list is Physical Servers, then the Measures list will be populated with a default set of test/measure pairs that reveal the health of the physical servers managed by the chosen vCenters;
All the above default settings can be overridden by the user using the eg_report.ini file (in the <EG_INSTALL_DIR>\manager\config directory), where he/she can add more metrics for use in the report, remove a few of the existing metrics, or simply apply additional functions (Avg, Max, etc.) on the metrics, so that users can more effectively analyze performance over time;
- Pick any test/measure combination from the Measures list to generate a report.
-
Then, specify the Timeline for the graph. You can either provide a fixed time line such as 1 hour, 2 days, etc., or select the Any option from the list to provide a From and To date/time for report generation.
Note:
For every user registered with the eG Enterprise system, the administrator can indicate the maximum timeline for which that user can generate a report. Once the maximum timeline is set for a user, then, whenever that user logs into eG Reporter and attempts to generate a report, the Timeline list box in the report page will display options according to the maximum timeline setting of that user. For instance, if a user can generate a report for a maximum period of 3 days only, then 3 days will be the highest option displayed in the Timeline list - i.e., 3 days will be the last option in the fixed Timeline list. Similarly, if the user chooses the Any option from the Timeline list and proceeds to provide a start date and end date for report generation using the From and To specifications, eG Enterprise will first check if the user's Timeline specification conforms to his/her maximum timeline setting. If not, report generation will fail. For instance, for a user who is allowed to generate reports spanning over a maximum period of 3 days only, the difference between the From and To dates should never be over 3 days. If it is, then, upon clicking the Run Report button a message box will appear, prompting the user to change the From and To specification.
-
In addition to the settings discussed above, this report comes with a set of default specifications. These settings are hidden by default. If you do not want to disturb these default settings, then you can proceed to generate the report by clicking the Run Report button soon after you pick a Measure. However, if you want to view and then alter these settings (if required), click on the
 icon. The default settings will then appear in the MORE OPTIONS drop down window (see Figure 2). The steps below discuss each of these settings and how they can be customized.
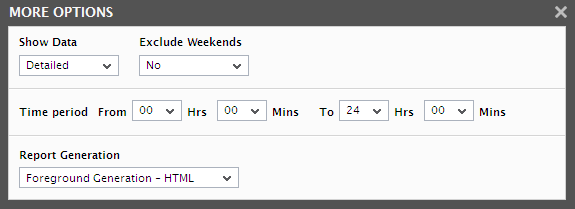
Figure 2 : The default settings for generating the Virtualization Manager report
-
The speed with which a report is generated depends primarily on the report Timeline. While a Timeline that varies between a couple of days to a week enables the eG Enterprise system to quickly retrieve the required data, timelines that span multiple weeks/months could slow-down the data retrieval and report generation process to a considerable extent, owing to the volume of data involved. In order to ensure quick and easy access to reports, eG Enterprise provides you the option of enabling data retrieval from the Trend information in the database, instead of the Detailed test information that is used by default for report generation. The Detailed test information based comprises of multiple measurement records for a test - one or more each for every test execution. Whereas, the Trend information includes only hourly, daily, and monthly summary computations for a test performed on a continuous basis. For instance, during a period of 1 hour, a test that runs every 5 minutes inserts atleast 12 records into the Detailed test information base. On the other hand, the Trend information base would consist of only 1 record for the same 1 hour period. Fewer the number of records, query execution becomes much quicker, and data retrieval faster. To use the trend data for report generation, you will have to select the Trend option from the Show Data field in Figure 2. By default, the Detailed option is selected in Figure 2 indicating that the report data is retrieved from the detailed test information in the database. If need be, you can also ensure that all reports always use the Detailed test tables alone by hiding the Show Data field from the reporter interface. To achieve this, do the following:
- Login to the eG administrative interface as 'admin'.
- Select the Manager option from the Settings tile that appears when the
 button against the Admin tab is clicked.
 -
From the GENERAL SETTINGS page that then appears, if you set the Compute average/sum of metrics while trending flag to No, then the Show Data field will not appear in the reporter interface; this denies users access to the Trend option, and thus ensures that reports are always generated using the Detailed tables.
Note:
- A Trendreport will not include the data for the current day since trend data is only computed at the end of the day.
- If the Trend option is chosen, the time period of the report should be greater than 1 day.
-
The usage of Detailed test tables for generating reports, especially those that span weeks, increases the stress on the eG database, thus resulting in undue delays in report generation. In order to ensure that the database is not choked by such voluminous data requests, you can configure eG Enterprise to automatically "force" the use of the Trend option if the Timeline of a report exceeds a pre-configured duration. To specify this time boundary, do the following:
- Edit the eg_report.ini file in the <EG_INSTALL_DIR>\manager\config directory.
- In the [MISC] section of the file, you will find a DetailedTime parameter.
- Specify the duration (in days) beyond which Detailed reports cannot be generated, against the DetailedTime parameter, and save the eg_report.ini file.
- For instance, to make sure that Detailed reports are disallowed for a Timeline of over 2 weeks, set the DetailedTime parameter to 14 and save the file.
- Say, subsequently, you attempt to generate a Detailed report for a FixedTimeline of 3 weeks (which is greater than the 14-day limit set in our example). The instant you select the 3 weeks option from the Fixed list box, the Detailed option gets automatically disabled, and the Trend option gets enabled. Similarly, if you specify an AnyTimeline that runs over 14 days, then, upon clicking the Run Report button to generate the report, a message box appears (see Figure 5.7) informing you that only the Trend option is permitted.
- To proceed with the Trend report generation, click the ok button in the message box. To terminate Trend report generation, click the Cancel button.
-
If the timeline specified for the report needs to exclude the data collected during the Weekends, then set Exclude weekends to Yes. If not, select No.
Note:
By default, the weekend constitutes Saturday and Sunday. To override this default setting, do the following:
- Edit the eg_report.ini file in the <EG_INSTALL_DIR>\manager\config directory.
- In the [virtual_center] section of the file, the exclude_weekendparameter is set to Saturday,Sunday by default. You can modify this by setting the exclude_weekend parameter to a comma-separated list of other days of the week - say Friday,Saturday.
- Save the file after making the required changes.
- Next, indicate the report Time period.
-
eG Enterprise allows users to generate desired reports for a specific time period. In large environments, while generating reports for long time periods, say a few weeks to months, report generation was found to slow down, owing to the large volume of data being processed. If users needed to generate many such reports quickly, the slowdown compelled them to generate these reports one after another, thus affecting the speed of their operations, and consequently, their productivity. eG Enterprise now includes a background processing feature that will enable users to process multiple reports, spanning long time periods in the background, while allowing them the bandwidth to generate short-term reports in the foreground. This way, users can generate multiple reports with little-to-no loss of time. To schedule background processing of a report, select the Background Save - PDF option from the Report Generation list. In this case, a Report Name text box will appear, where you would have to provide the name with which the report is to be saved in the background. To process reports in the foreground, select the Foreground Generation - HTML option from this list.
Note:
- The Report Generation list will appear only if the EnableBackgroundReport flag in the [BACKGROUND_PROCESS] section of the eg_report.ini file (in the [EG_INSTALL_DIR]\manager\config directory) is set to Yes.
- The default selection in the Report Generation list will change according to the Timeline specified for the report. If the Timeline set is greater than or equal to the number of days specified against the MinDurationForReport parameter in the [BACKGROUND_PROCESS] section of the eg_report.ini file, then the default selection in the Report Generation list will be Background. On the other hand, if the Timeline set for the report is lesser than the value of the MinDurationForReport parameter, then the default selection in the Report Generation list will be Foreground. This is because, the MinDurationForReport setting governs when reports are to be processed in the background. By default, this parameter is set to 2 weeks - this indicates that by default, reports with a timeline of 2 weeks and above will be processed in the background.
-
Finally, click the Run Report button.
-
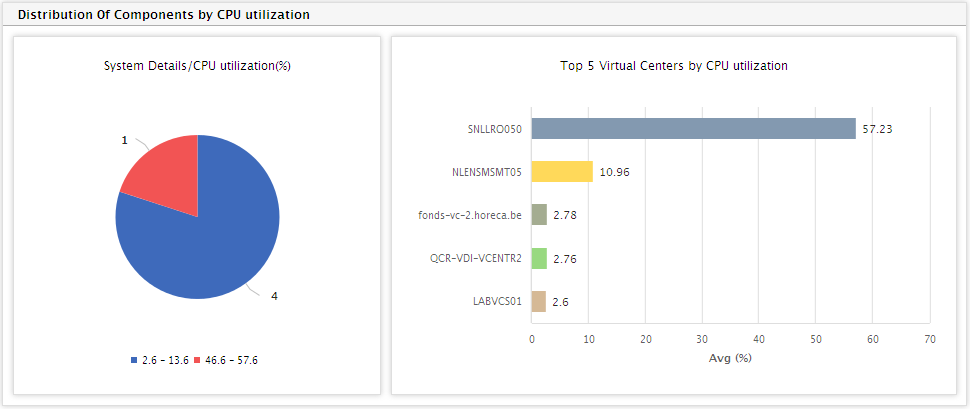
If the Report Type is Graph and the option chosen from the Report Generation list is Foreground Generation - HTML, then, clicking on the Run Report button will invoke Figure 3 will appear comprising of the following:
-
A distribution pie chart that reveals the number of vCenters in different distribution ranges (see Figure 3). The distribution ranges are obtained by applying the first of the configured functions on the chosen Measure. For instance, assume that CPU Utilization is the chosen Measure. Say that you have configured to display the Avg and Max of this measure in a Data report. Typically, both these configured values will appear only in the Data report. In the case of a Graph report however, the first of the two functions - i.e., Avg of CPU Utilization- alone is calculated for every vCenter chosen from the Components list. The resulting pie chart enables administrators to deduce, at a glance, the number of components where the chosen performance metric has fared well and/or badly. Clicking on a particular slice in the pie chart lists the vCenter servers that fall within the value range represented by that slice (see Figure 4). Against every vCenter name, the actual values for each of the configured functions (both Avg and Max, in our example) will be displayed. A zone/component-type-level Summary of the chosen Measure will also be available.
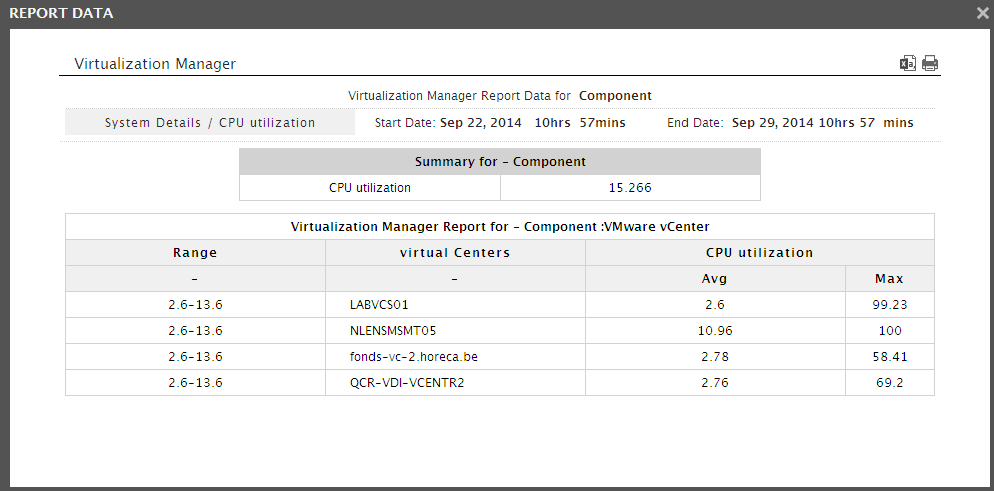
Figure 4 : A list of vCenters and the CPU Utilization of each Virtual Center
Note:
By default, the chart type for distribution is a pie chart. However, you can have a bar graph depict the same data instead of a pie chart, by following the steps given below:
- Edit the eg_report.ini file in the <EG_INSTALL_DIR>\manager\config directory.
- Change the value of the chartTypeForDist parameter in the [virtual_center] section of this file from the default Pie, to Bar.
- Save the eg_report.ini file.
By default, the number of value ranges that need to be configured for the distribution chart is 10. To override this default setting, do the following:
- Edit the eg_report.ini file in the <EG_INSTALL_DIR>\manager\config directory.
- Specify a number of your choice against the nofRangeForDist parameter in the [virtual_center] section of this file. By default, this parameter will hold the value 10.
- Save the eg_report.ini file.
-
Adjacent to the pie chart, you will find a bar chart that indicates the vCenters that have topped/failed in a selected performance realm (i.e., the Measure) during the specified Timeline. For example, for the CPU Utilizationmeasure, this bar chart reveals the vCenters that are consuming too much of CPU resources. Like the pie chart, the values for the bar chart are also calculated by applying the first of the configured functions on the chosen Measure.
Note:
You can configure the colors to be used in the distribution chart and the Top <N> Components bar chart in the zone report, by editing the eg_report.ini file in the <EG_INSTALL_DIR>\manager\config directory. The [VIRTUAL_center] section of the file defines the 20 default colors of the distribution and bar charts:
[VIRTUAL_GUEST]
ChartColor=#8399b0,#ffd95a,#a4ac91,#98d980,#d5b996,#f48848,#8b8cc2,
#eb4052,#c4b3d0,#b18651,#ebb7ce,#028768,#f5c372,#887c65,#e4c536,
#b5582c,#f94989,#770d72,#97a067,#89aeb7distColor=#115fa6,#f25454,#60bd68,#b276b2,#81bef7,#a61120,#ffd13e,
#770d72,#887c65,#a4ac91You override the default color settings of the distribution chart by modifying the color-codes specifying against distColor. For changing the colors used by the Top <N> Components chart, alter the codes listed against the ChartColor parameter.
Note:
The number of components to be displayed in the Top <N> Components bar chart is configurable. To specify the number, do the following:
- Edit the eg_report.ini file in the <EG_INSTALL_DIR>\manager\config directory.
- Specify a number of your choice against the NoOfServersforChart parameter in the [virtual_center] section of the file. By default, the value displayed here is 10, indicating that, by default, the bar chart will be for the Top 10 Components. For example, if you change this value to 5, then a bar chart displaying the Top 5 Components will appear.
- Finally, save the eg_report.ini file.
-
- Unlike a Graph report, a Data report does not graphically represent the measure data. Instead, the configured details are presented in a tabular format in the report.
-
If the Report Type is Data, then the report can be configured to include data pertaining to vCenters, VM Clusters, and/or Physical Servers. You can indicate your choice by selecting one/more check boxes against the Include Stats for field.
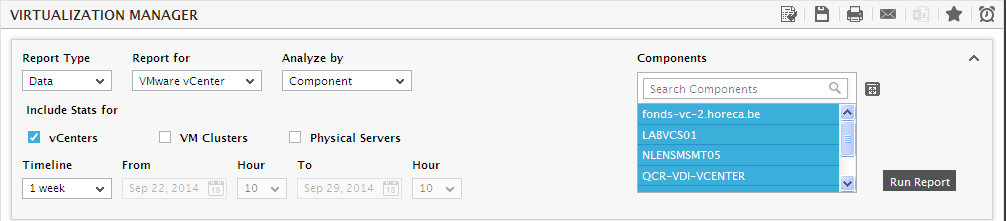
Figure 5 : Specifying the criteria for a VCenters Data report
- Also, if the vm Clusters check box is selected, you would be allowed to select a report column name from the Sort by list. This is the column by which the report data will be sorted.
-
Once the Run Report button is clicked, the Data report will appear displaying multiple values for a chosen measure depending upon the number and type of functions that have been configured for the measure. Moreover, to enable you to understand and analyze the metrics better, eG Enterprise groups the metrics under various heads, and dedicates a section each in the report for every metric group. The sections that are displayed in the report vary according to the check boxes selected against Include Stats for.
For instance, if the vCenters option is chosen from Include Stats for, the resulting report will include two sections - namely, the System Report sectionand the Application Report section. Typically, the System Report section groups all host-level metrics pertaining to the chosen vCenter servers - in other words, it reveals the health of the operating system on which each vCenter server functions. The Application Report section on the other hand delves deep into the performance of the vCenter application as such, and reveals those metrics that shed light on the health of key functions of the vCenter, such as, how well the vCenter manages physical servers, how quickly can the vCenter be accessed, the availability of vCenter, etc. In addition to vCenter-wise performance information, these sections also provide a Summary of the operating system and application health (as the case may be) across the chosen Components.
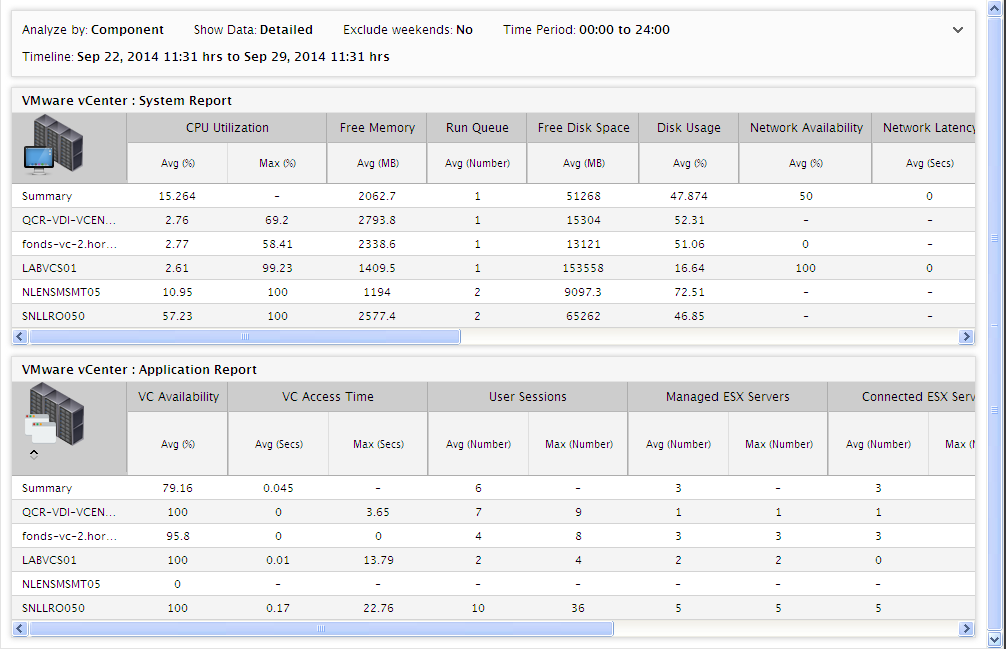
Figure 6 : A Virtualization Manager Data Report if the ‘Include Stats for’ flag is set to ‘vCenters’
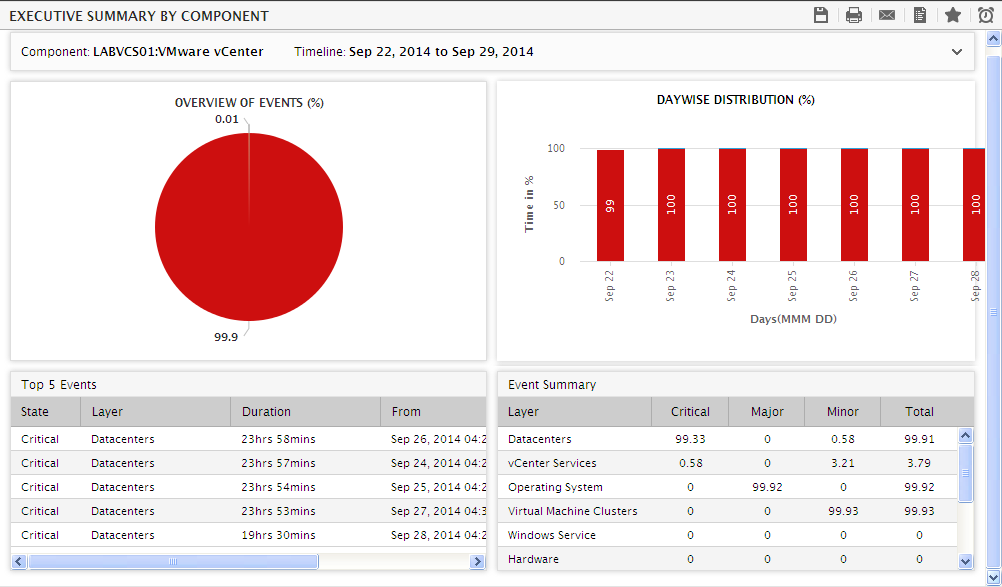
To instantly determine the overall health of the vCenter application over time, just take a look at the values displayed in the Health % column of Figure 6. Clicking on this value for any vCenter will lead you to an Executive Report that will enable you to decipher the reasons for the ill-health of a vCenter (see Figure 7).
-
Clicking on a particular vCenter link in Figure 6 reveals the clusters managed by that vCenter server and the memory and CPU usage metrics related to each cluster (see Figure 8.
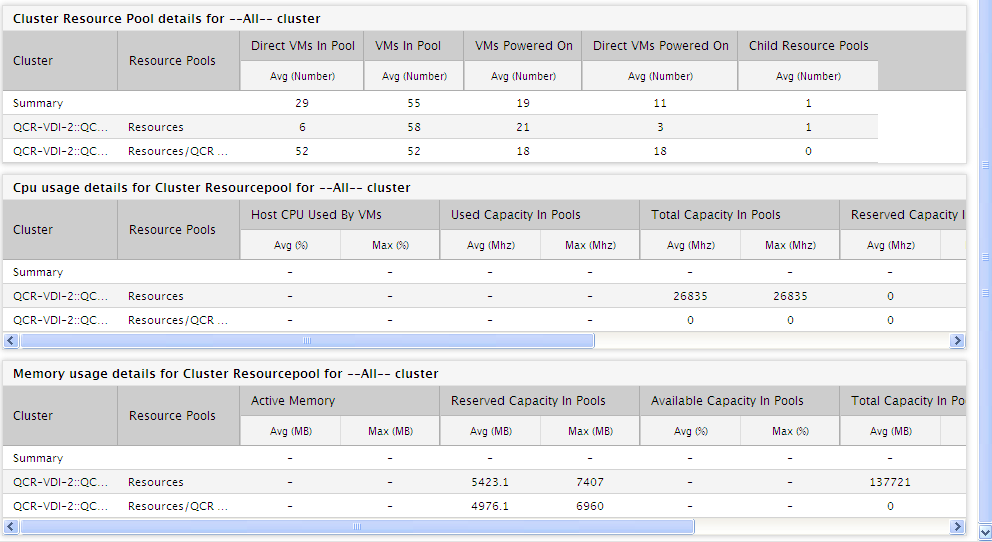
Figure 8 : The Cluster Details report of the vCenter clicked on
-
If the vm Clusters option is chosen from the Include Stats for field, then, a Cluster Report section alone will appear that lists the user-configured cluster-related metrics pertaining to each of the chosen vCenter servers. Here again, a Summary of cluster performance across the chosen components will be available.
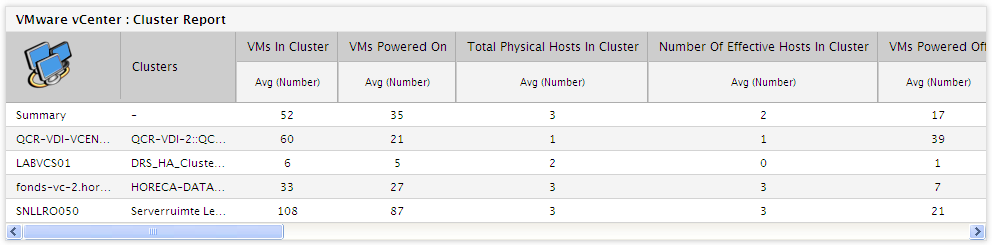
Figure 9 : A vCenters Data report if the ‘Include Stats for’ flag is set to ‘VM Clusters’
-
While clicking on a vCenter server in Figure 9 leads you to the Cluster Details report of that vCenter server, clicking on a cluster link in Figure 9 leads you to the Cluster Details report of that cluster, which lists the resource pools within the cluster, and the resource usage of each pool (see ).
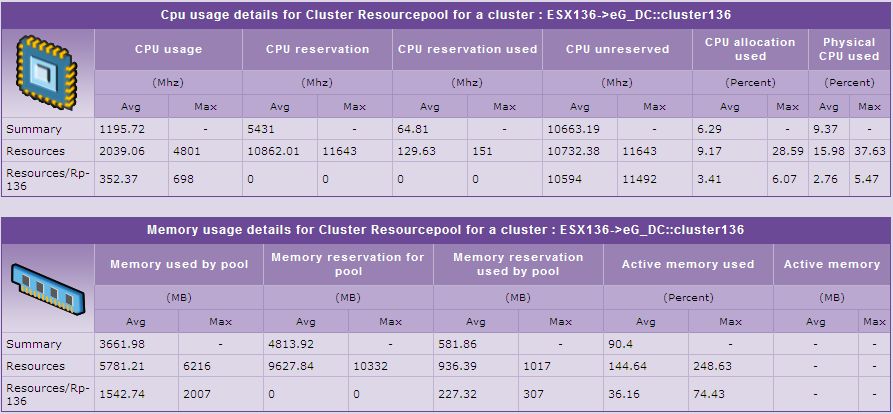
Figure 10 : The Cluster Details report of a cluster clicked on
-
Similarly, if the Physical Servers option is chosen, then, a Physical Server Report alone will be available, which displays the historical performance data related to the physical servers managed by each of the chosen vCenter servers. This section again will provide a Summary of the resource usage by physical servers managed across the chosen vCenter components.
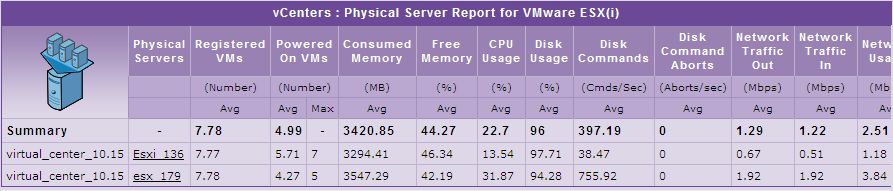
Figure 11 : A vCenters Data report if the ‘Include Stats for’ flag is set to ‘Physical Servers’
-
Click on a Physical Server link in Figure 11 to view a Server Report of that ESX server, using which the overall health of the server can be determined (see Figure 12).
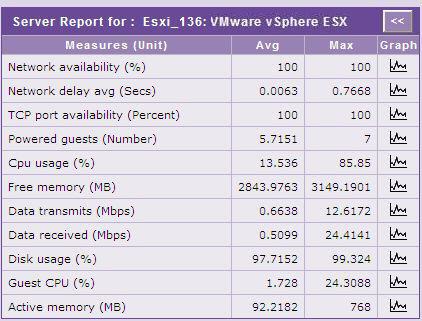
Figure 12 : The Server Report of the ESX server clicked on in the vCenter Data Report
Note:
The metrics displayed under every section of the Data report and the functions to be applied on every measure are pre-configured. The same configuration applies to the Measures list in the case of a Graph report. To override this default configuration, do the following:
- Edit the eg_report.ini file in the <EG_INSTALL_DIR>\manager\config directory.
-
In the [virtual_center] section of the file, you can add/remove metrics and functions to every section in the data report. For instance, to add a measure to the System Report section of the data report, insert a line in the following format:
Virtual_center:System:<InternalTestName>:<InternalMeasureName>#<MeasureDisplayName>=<Comma-separated list of functions>
For instance, to add the Run queue length measure to the System Report section, do the following:
Virtual_center:System:SystemTest:Run_queue_length#Run queue=Avg,Max
Similarly, to display an additional measure and related functions in the Application Report section of the data report, your entry should be:
Virtual_center:Default:<InternalTestName>:<InternalMeasureName>#<MeasureDisplayName>=<Comma-separated list of functions>
All the metrics configured for the ‘System’ group and ‘Application’ group will be listed in the ‘Measures’ list of the Graph report, if the option chosen from the ‘Show Stats for’ list is ‘VCenters’.
Likewise, you can add a metric to the Cluster Report section of the data report:
Virtual_center:Cluster:<InternalTestName>:<InternalMeasureName>#<MeasureDisplayName>=<Comma-separated list of functions>
All the metrics configured for the ‘Cluster’ group will be listed in the ‘Measures’ list of the Graph report, if the option chosen from the ‘Show Stats for’ list is ‘VCenter Clusters’.
However, to add a measure to the Physical Servers section of the data report, you will have to move to the [virtual_host] section of the eg_report.ini file, and insert a line of the following format:
<InternalTestName>:<InternalMeasureName>#<MeasureDisplayName>=<Comma-separated list of functions>
For instance, to add the Registered guests measure to the Physical Servers section, your specification should be:
EsxGuestStatusTest:Registered_guests#Registered guests=Avg,Max
All the metrics configured under the [virtual_host] section will be listed in the ‘Measures’ list of the Graph report, if the option chosen from the ‘Show Stats for’ list is ‘Physical Servers’.
- Finally, save the file.