Virtualization - VMware VMotion Report
VMware VMotion technology, unique to VMware, leverages the complete virtualization of servers, storage and networking to migrate an entire running virtual machine instantaneously from a failing/underperforming server to a healthy one, to ensure high availability of the virtual machine.
In large, mission-critical virtualized environments with hundreds of hosts and VMs, the vCenter may migrate VMs frequently and in large numbers, so as to avoid service outages and performance degradations. Administrators of such environments might therefore find it difficult to manually track the movement of the virtual machines; as a consequence, they might not be able to determine the type/status of the migration activities, or accurately identify the current location of a VM. The absence of a specialized migration monitoring mechanism also renders these administrators unable to isolate resource-hungry VMs and resource-deficient hosts in the target environment.
To address these concerns, eG Reporter allows the generation of a specialized VMotion Report. Using the graphical/tabulated results provided by this report, administrators can perform the following:
- Easily observe and effectively analyze the migration activity over time, and understand the types of migration that were performed during the stated time;
- Detect failed migrations, identify the user(s) responsible for the same, and diagnose the reasons for the failure;
- Track the movement of specific VMs and accurately identify their current destination;
- Instantly identify under-performing hosts and/or resource-intensive guests in the target environment, on the basis of the migration activity;
In order to enable the administrator to accomplish the above, the VMotion Report page allows you to generate three different types of reports, namely - the VMotion Summary & Top N (Graph), VMotion Summary & Top N (Data), and VMotion Details report.
The sections that follow will discuss each of these report types in detail.
VMotion Summary & Top N (Graph) Report and VMotion Summary & Top N (Data) Report
These two reports enable you to take stock of the extent, nature, and status of the migration activity across the environment during a given period of time. While the VMotion Summary & Top N (Graph) report graphically represents the migration details, the VMotion Summary & Top N (Data) report tabulates the same results.
Besides revealing the total number, type, and status of migrations that have taken place in the environment during the given period, these reports help determine the following:
- Which VM was migrated the maximum number of times?
- What type of migration was most common in the environment during the designated period?
- On which days was the migration activity very high?
- From which ESX host/cluster were the maximum number of migrations performed?
- To which ESX host/cluster were the maximum number of VMs migrated?
- Which VM migration failed the maximum number of times?
- From which ESX host/cluster were the maximum number of failed migrations attempted?
- The migrations to which ESX host/cluster failed often?
By periodically reviewing these results, you can identify those VMs that were migrated often, and also those ESX hosts/clusters from which VMs have been frequently moved out - since VM migration is typically driven by the resource availability with a host and the resource usage by a VM, you can accurately isolate resource-intensive VMs and unhealthy hosts/clusters with the help of this report.
To generate these reports, follow the steps given below:
-
Select VMotion from the Virtualization node of the REPORTS BY FUNCTION tree in the eG Reporter.
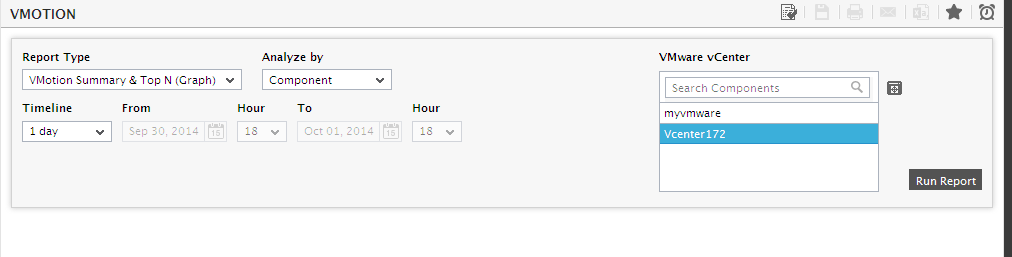
Figure 1 : Specifying the criteria for generating a VMotions Summary Report
- When Figure 1 appears, first, indicate the Report Type. Set VMotion Summary & Top N (Graph) or VMotion Summary & Top N (Data) as the Report type.
-
Next, from the VMware vCenter list, select the vCenter server(s) for which the migration report is to be generated. By default, all the managed vCenter servers in your environment will be listed here. This is because, the default selection from the Analyze by list is Component. You can however narrow your search by opting to view only those vCenter servers that are part of a service/segment/zone in the VMware vCenter list. For this, select the Zone, Service, or Segment, option from the Analyze by field:
- Selecting the Zone option will allow you to select the desired zone from the Zone list box. To include the vCenter servers within a specific subzone also in the VMware vCenter list, set the Include subzone flag to Yes.
- In the same way, to make the vCenter servers that are part of a particular segment or service available for selection in the VMware vCenter list, select Service or Segment from the Analyze By list box. Then, select the desired service or segment from the Service or Segment list.
- If the VMware vCenter list consists of too many vCenter servers, then viewing all the components and selecting the ones you need for report generation could require endless scrolling. To avoid this, you can click the
 button next to the VMware vCenter list. The VMWARE VCENTER pop up window will then appear using which you can view almost all the vCenter servers in a single interface and Select the ones for which the report is to be generated.
-
Then, specify the Timeline for the graph. You can either provide a fixed time line such as 1 hour, 2 days, etc., or select the Any option from the list to provide a From and To date/time for report generation. By default, 1 day will be selected from the Timeline list box.
Note:
For every user registered with the eG Enterprise system, the administrator can indicate the maximum timeline for which that user can generate a report. Once the maximum timeline is set for a user, then, whenever that user logs into eG Reporter and attempts to generate a report, the Timeline list box in the report page will display options according to the maximum timeline setting of that user. For instance, if a user can generate a report for a maximum period of 3 days only, then 3 days will be the highest option displayed in the Timeline list - i.e., 3 days will be the last option in the fixed Timeline list. Similarly, if the user chooses the Any option from the Timeline list and proceeds to provide a start date and end date for report generation using the From and To specifications, eG Enterprise will first check if the user's Timeline specification conforms to his/her maximum timeline setting. If not, report generation will fail. For instance, for a user who is allowed to generate reports spanning over a maximum period of 3 days only, the difference between the From and To dates should never be over 3 days. If it is, then, upon clicking the Run Report button a message box will appear, prompting the user to change the From and To specification.
-
In addition to the settings discussed above, this report comes with a set of default specifications. These settings are hidden by default. If you do not want to disturb these default settings, then you can proceed to generate the report by clicking the Run Report button soon after you pick one/more VMware vCenter servers. However, if you want to view and then alter these settings (if required), click on the
 icon. The default settings will then appear in the MORE OPTIONS drop down window (see Figure 2). The steps below discuss each of these settings and how they can be customized.
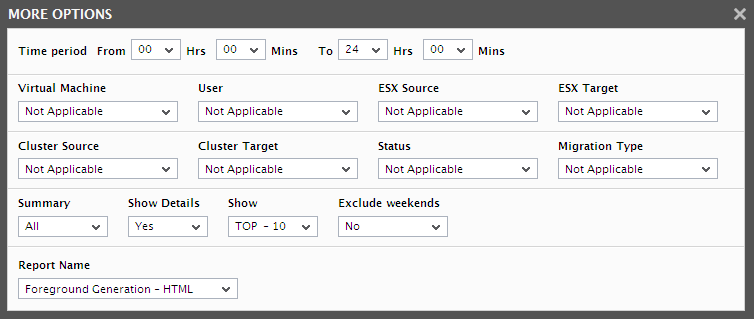
Figure 2 : The default settings for generating the VMotion report
- Next, indicate the report Time period. By default 00 Hr and 24 Min, 24 Hr and 00 Min will be selected in the From and To fields.
-
If the timeline specified for the report needs to exclude the data collected during the Weekends, then set Exclude weekends to Yes. If not, select No.
Note:
By default, the weekend constitutes Saturday and Sunday. To override this default setting, do the following:
- Edit the eg_report.ini file in the <EG_INSTALL_DIR>\manager\config directory.
- In the [VIRTUAL_CENTER] section of the file, the EXCLUDE_WEEKEND parameter is set to Saturday,Sunday by default. You can modify this by setting the EXCLUDE_WEEKEND parameter to a comma-separated list of other days of the week - say Friday,Saturday.
- Save the file after making the required changes.
- By default, this report provides a quick summary of the migrations related to all the VMs managed by the chosen vCenter servers. Accordingly, the All option is chosen by default in the Virtual Machine list. To view a report pertaining to a particular VM instead, select a specific VM from the Virtual Machine list.
- To view a report on migrations that were initiated by a specific user, select the user name from the User list box. The default report however pertains to all users; accordingly, the All option is chosen by default from the User list.
- If you want to view a report on VMs that were migrated from a particular ESX server, then select the server from the esx Source list. By default, this report provides the details of migrations from all ESX servers managed by the chosen vCenter server. Accordingly, the All option is chosen by default from the esx Source list.
- For a report on VMs that were moved to a particular ESX server, select the destination server from the esx Target list. By default however, this report focuses on VM migrations to all the ESX servers managed by the selected vCenter servers. Accordingly, the All option is chosen by default from the ESX Target list.
- If you want to view a report on VMs that were migrated from a particular cluster, then select the cluster from the Cluster Source list. By default, this report provides the details of migrations from all clusters managed by the chosen vCenter server. Accordingly, the All option is chosen by default from the Cluster Source list.
- For a report on VMs that were moved to a particular cluster, select the destination cluster from the Cluster Target list. By default however, this report focuses on VM migrations to all the clusters managed by the selected vCenter servers. Accordingly, the All option is chosen by default from the Cluster Target list.
- By default, this report provides a summary of all migrations that occurred in an environment, regardless of their status. This explains why the default option chosen from the Status list is All. However, to view a report on the migrations of a particular state, select Success or Failure from the Status list.
-
Similarly, you can configure the report to provide the summary of migrations of a particular type, by selecting one of the following types from the Migration Type list:
- DRS: Refers to DRS-recommended migrations
- Hot: Refers to powered-on virtual machines moved from one server to another
- Manual: Refers to powered-off or suspended virtual machines moved from one server to another
By default however, this report provides migration summaries for all types of migrations; accordingly, the All option is chosen by default from the Migration Type list.
-
By default, every VMotion Summary report (be it Graph or Data) generated using this page includes a VMotion Migration Summary Details section that provides an environment-wide overview of the migration activity during the specified Timeline. You can however, optionally configure this report to include a few/more additional summary sections that focus on a particular aspect of migration, namely - the VM, the source ESX host, the target ESX host, the source cluster, and the target cluster. By choosing an option from the Summary list box, you can indicate what additional summaries the report should include:
- VM : If the All option is chosen from the Virtual Machine list and the Show Details flag is set to Yes, then, selecting the vm option from the Summary list ensures that the report includes additional sections that provide a VM-level migration summary - these sections indicate the VMs that have been migrated the maximum number of times, and the VMs with the highest number of migration failures.
- Source ESX : If the All option is chosen from the ESX Source list and the Show Details flag is set to Yes, then, selecting the Source ESX option from the Summary list results in a report that includes additional sections that provide a source-level migration summary - these sections indicate the ESX servers that have been the source of the maximum number of successful migrations and failed migrations.
- Target ESX : If the All option is chosen from the ESX Target list and the Show Details flag is set to Yes, then, selecting the Source ESX option from the Summary list results in a report that includes additional sections that provide a migration summary with a destination-focus - these sections indicate the target ESX servers to which the highest number of VMs have been migrated and the target ESX servers with the maximum failed migrations.
- Source Cluster : If the All option is chosen from the Cluster Source list and the Show Details flag is set to Yes, then, selecting the Source Cluster option from the Summary list results in a report that includes additional sections that provide a cluster-level migration summary - these sections indicate the clusters that have been the source of the maximum number of successful migrations and failed migrations.
- Target Cluster : If the All option is chosen from the Cluster Target list and the Show Details flag is set to Yes, then, selecting the Target Cluster option from the Summary list results in a report that includes additional sections that indicate the target clusters to which the highest number of VMs have been migrated and the target clusters with the maximum failed migrations.
- All : By default, this option is chosen from the Summary list. In this case, if the Show Details flag is set to Yes, then, the additional sections that the report embeds will provide all the above-mentioned information.
-
By default, this report only provides an environment-wide migration summary displaying the total number of migrations that have occurred across all the chosen vCenter servers during the designated period, and the type-wise break-up of migrations. Accordingly, the Show Details flag is set to No by default. If this flag is set to Yes instead, then additional sections will be displayed according to the option chosen from the Summary list.
Note:
By default, this report provides all the filter options discussed in step 11 to step 20 above, so that you an customize the summary report to suit your needs. If need be, you can hide the filter options and thus make sure that the report displays a summary of all the migrations that occurred in the environment during the specified Timeline. To achieve this, do the following:
- Edit the eg_report.ini file in the <EG_INSTALL_DIR>\manager\config directory.
- In the VIRTUAL_CENTER_VMOTION section of the file, set the ShowFilters flag to false. By default, this flag is set to true.
- Finally, save the file.
Once this is done, all the filter options starting from the Virtual Machine list box to the Summary list box will no longer appear in the report page. This implies that after specifying the report Timeline, you will have to switch to step 20 of this procedure to proceed with the report generation.
- To view the report for top N items or last N items alone, select the required option from the Show list box. For instance, to view only the top-2 VMs that have registered the highest number of migrations during the stated period, select the top-2 option from the Show list. By default, the TOP - 10 option will be selected.
-
In large environments, reports generated using months of data can take a long time to complete. Administrators now have the option of generating reports on-line or in the background. When a report is scheduled for background generation, administrators can proceed with their other monitoring, diagnosis, and reporting tasks, while the eG manager is processing the report. This saves the administrator valuable time. To schedule background processing of a report, select the Background Save - PDF option from the Report Generation list. In this case, a Report Name text box will appear, where you would have to provide the name with which the report is to be saved in the background. To process reports in the foreground, select the Foreground Generation - HTML option from this list.
Note:
- The Report Generation list will appear only if the EnableBackgroundReport flag in the [BACKGROUND_PROCESS] section of the eg_report.ini file (in the [EG_INSTALL_DIR]\manager\config directory) is set to Yes.
- The default selection in the Report Generation list will change according to the Timeline specified for the report. If the Timeline set is greater than or equal to the number of days specified against the MinDurationForReport parameter in the [BACKGROUND_PROCESS] section of the eg_report.ini file, then the default selection in the Report Generation list will be Background. On the other hand, if the Timeline set for the report is lesser than the value of the MinDurationForReport parameter, then the default selection in the Report Generation list will be Foreground. This is because, the MinDurationForReport setting governs when reports are to be processed in the background. By default, this parameter is set to 2 weeks - this indicates that by default, reports with a timeline of 2 weeks and above will be processed in the background.
- Finally, click on the Run Report button.
-
If the Report Type chosen is VMotion Summary & Top N (Graph) and the Show Details flag is set to No, then, the resulting report (see Figure 3) will display a Virtual Machines Migration Summary, which enables you to quickly receive a fair understanding of the volume of the migration activity in your environment during the specified Timeline. The total migrations, the number of migrations per type, and the number of failed migrations are available here.
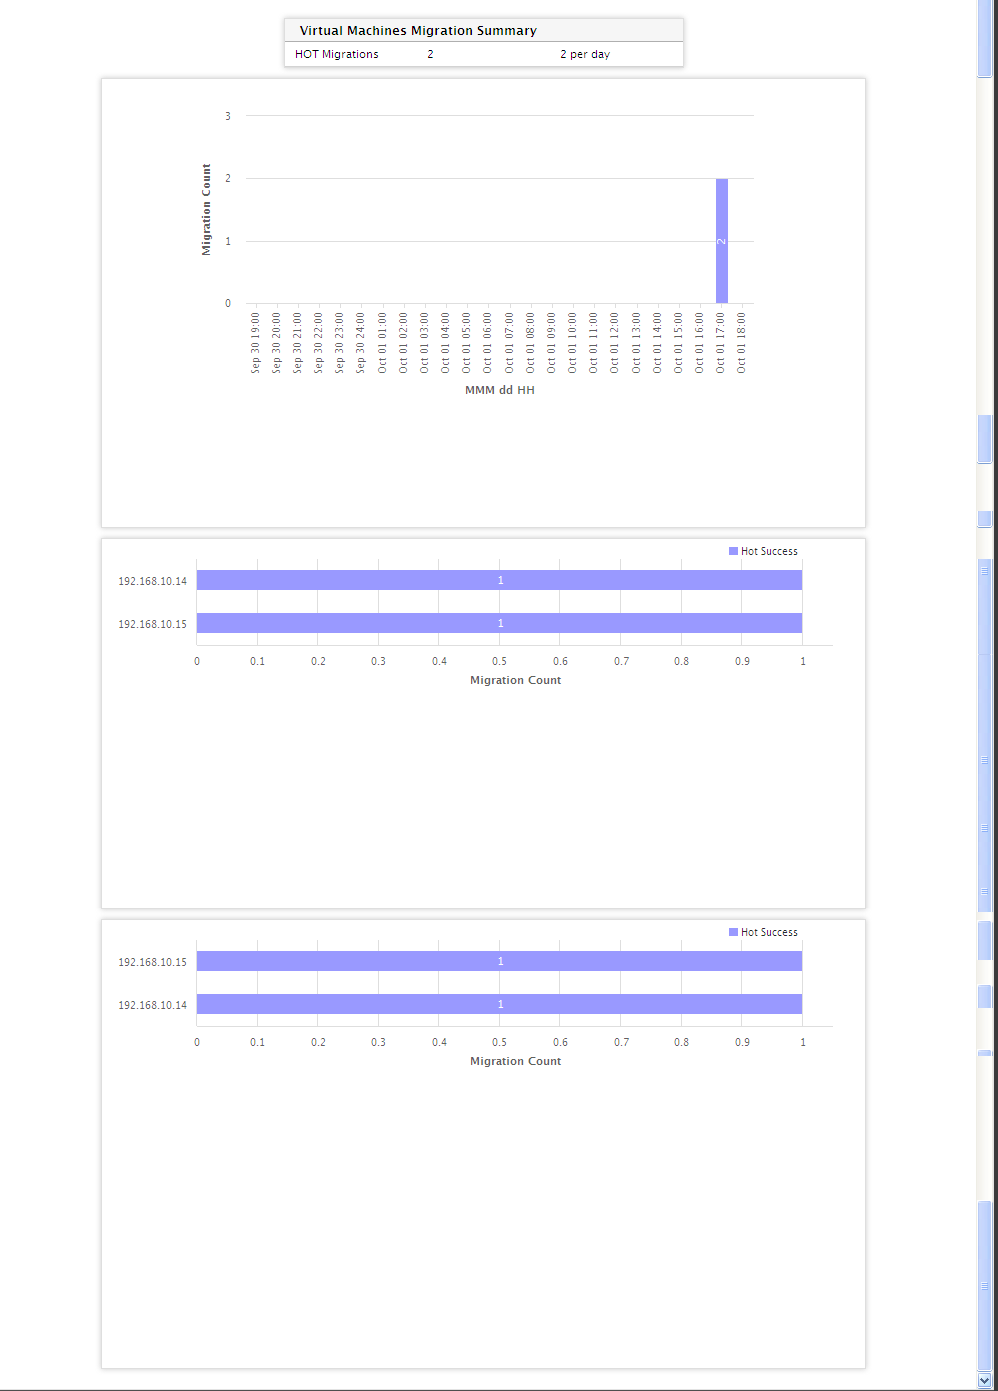
Figure 3 : The default VMotion Summary & Top N (Graph) report
-
Clicking on the Total migrations value in the Virtual Machines Migrations Summary table leads you to the vmotion details report that provides complete details of all the migrations that occurred in the environment during the specified Timeline. Similarly, you can click on the number of drs migrations, Hot migrations, Manual migrations, or Failed migrations in the table to view the details of migrations of that type.
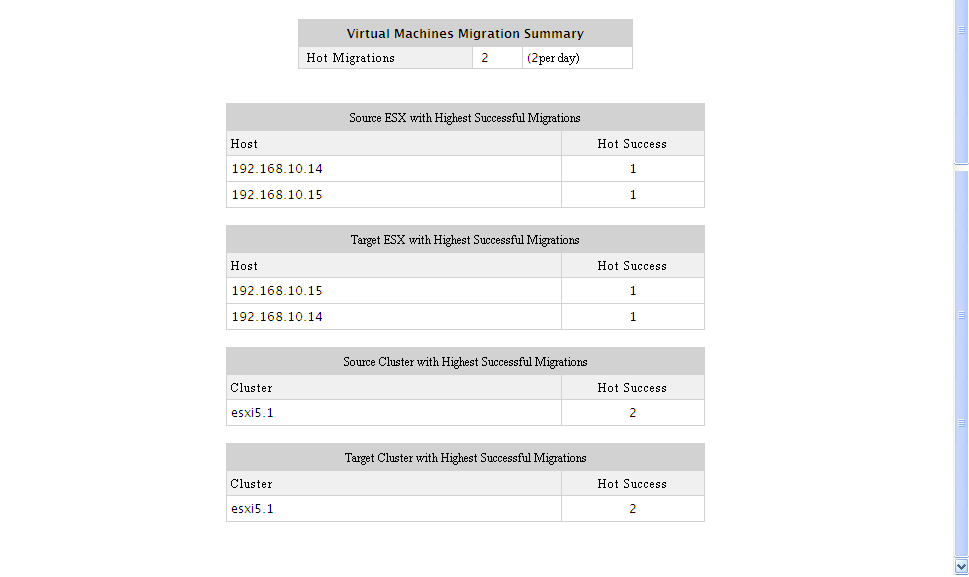
Figure 4 : A VMotions Details report that provides details of all migrations that occurred in the specified Timeline
- Below the Virtual Machines Migration Summary table of Figure 3, you will find a Virtual Machines Migration Chart that enables you to figure out how many migrations occurred every day during the specified Timeline, how many of them failed, and also the migration types. Using this chart, you can instantly identify those days on which the migration activity peaked, and the exact day on which they failed.
-
To view the complete details of the migrations of a particular type on a specific day, click on the corresponding division in the bar chart of Figure 4. This will invoke Figure 5, where you can view more details about that migration type.
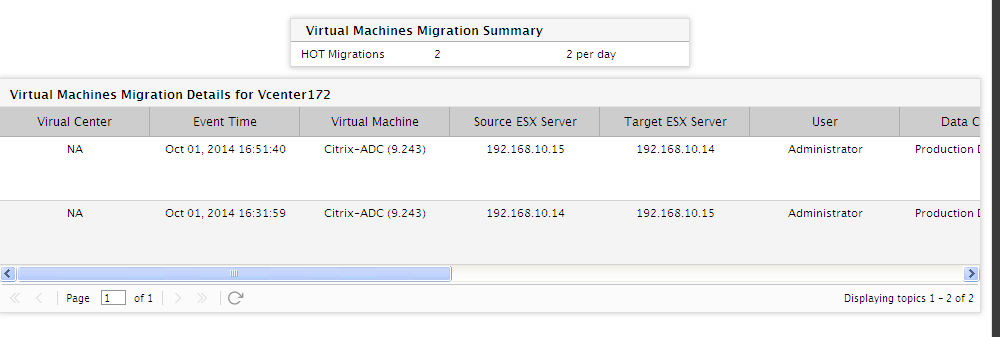
Figure 5 : The VMotion Details report that appears upon clicking a division in the bar chart
-
On the other hand, if the Report Type for the summary report is set to VMotion Summary & Top N (Data) and the Show Details flag is set to No, then, the resulting report will only display the Virtual Machines Migration Summary table.
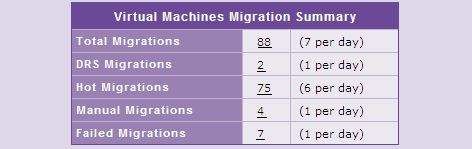
Figure 6 : The default VMotion Summary & Top N (Data) report
-
Now, if the Show Details flag is set to Yes, and the vm option is chosen from the Summary list, then, the VMotion Summary & Top N (Graph) report will additionally display 3 bar charts, and the VMotion Summary & Top N (Data) report will display 3 additional tables. Each of these bar charts/tables will indicate the following:
- The VMs with the highest number of migrations;
- The VMs with the highest number of successful migrations;
- The VMs with the highest number of failed migrations;
From this information, you can easily isolate resource-intensive VMs, and also instantly spot failed migration attempts.
In case of the VMotion Summary & Top N (Graph) report, clicking on any division in any bar graph will allow you to zoom into the details of the migrations of that type for that VM.
In case of the VMotion Summary & Top N (Data) report, clicking on any Virtual Machine name in the VM-related sections will take you to a VMotion Details report that provides the complete details of all the times that VM was migrated.
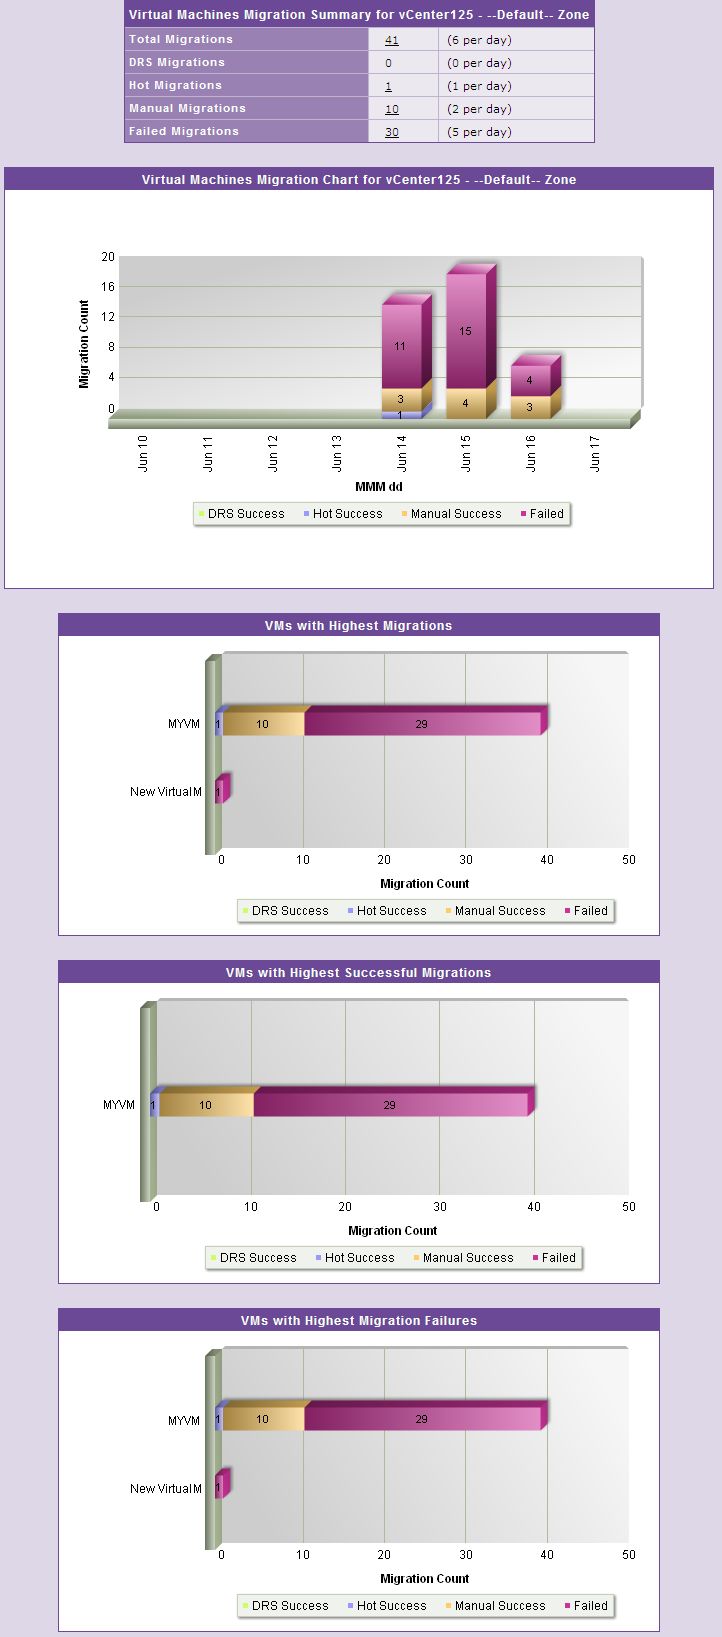
Figure 7 : The VMotion Summary Graph report if the VM option is chosen from the Summary list
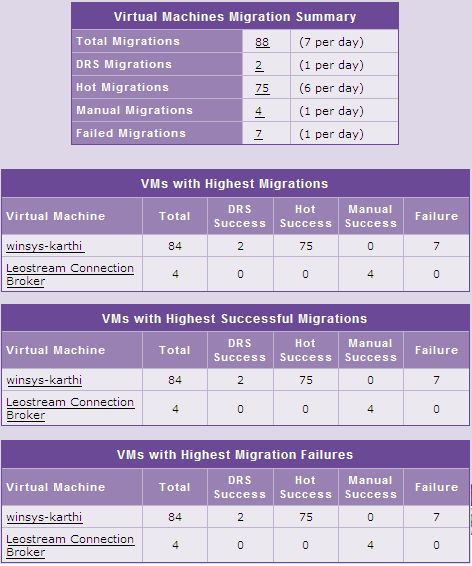
Figure 8 : The VMotion Data Report if the VM option is chosen from the Summary list
-
Similarly, if the Show Details flag is set to Yes, and the Source ESX option is chosen from the Summary list, then, the VMotion Summary & Top N (Graph) report will additionally display 3 bar charts, and the VMotion Summary & Top N (Data) report will display 3 additional tables. Each of these bar charts/tables will indicate the following:
- The ESX servers from which the highest number of migrations have been performed;
- The ESX servers from which the highest number of successful migrations have been performed;
- The ESX servers with the highest number of failed migrations;
From this information, you can easily isolate hosts that are experiencing a contention for resources.
In case of the VMotion Summary & Top N (Graph) report, clicking on any division in any bar graph will allow you to zoom into the details of the migrations of that type for that ESX server.
In case of the VMotion Sumary & Top N (Data) report, clicking on a Host in the source-related tables will lead you to a VMotion Details report pertaining to that host.
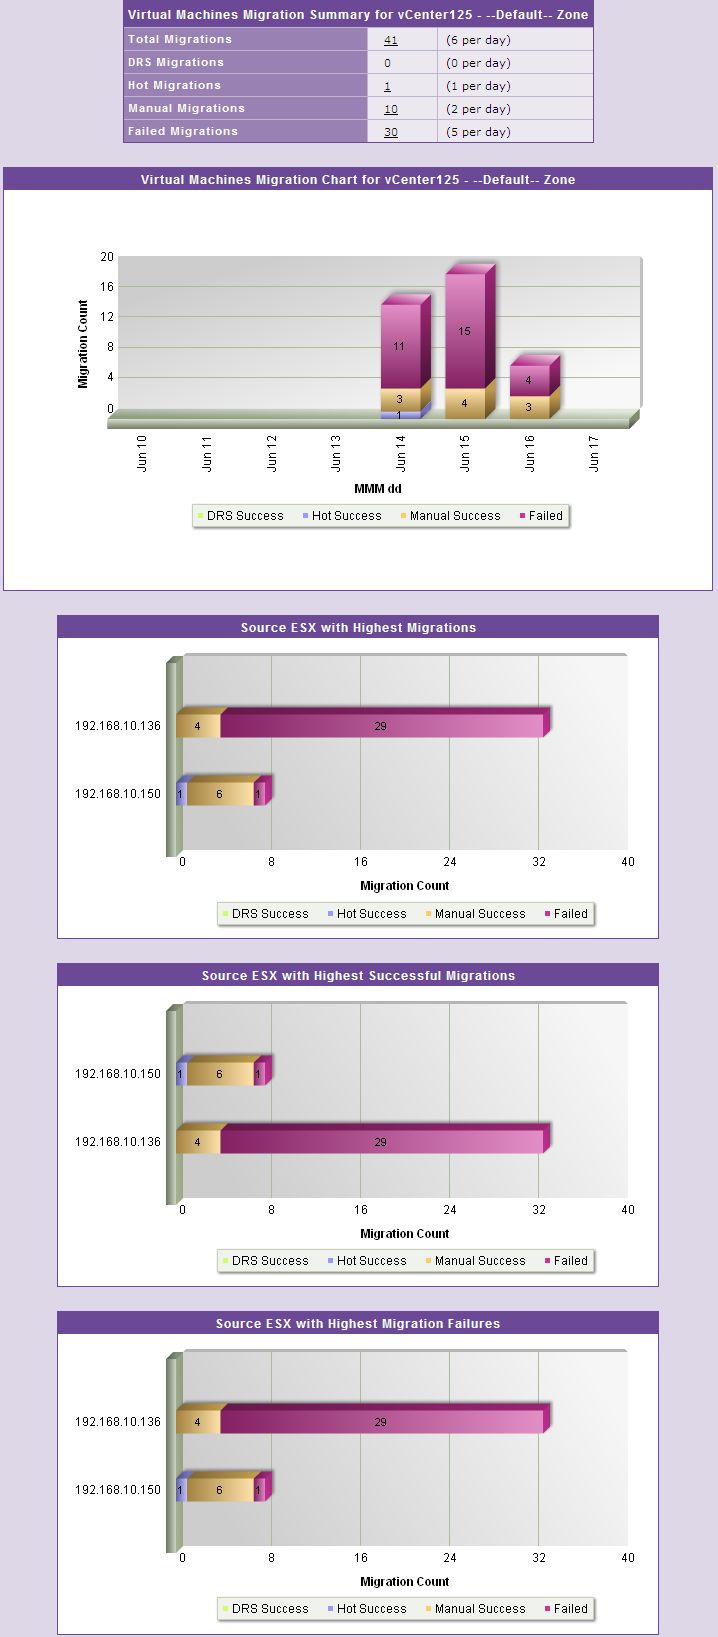
Figure 9 : The VMotion Summary Graph report if the Source ESX option is chosen from the Summary list
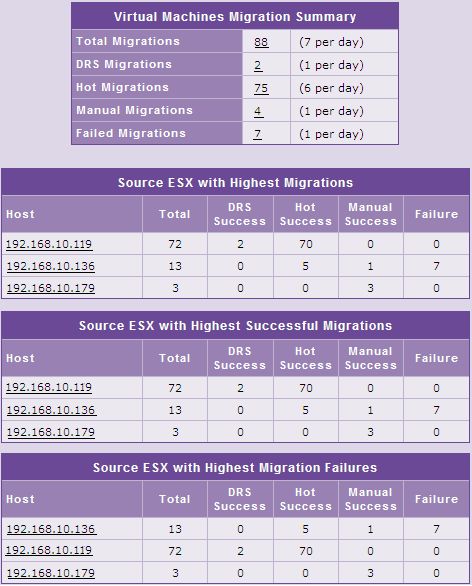
Figure 10 : The VMotion Data Report if the Source ESX option is chosen from the Summary list
-
With the Show Details flag set to Yes, if you pick the Target ESX option from the Summary list, then, the VMotion Summary & Top N (Graph) report will additionally display 3 bar charts, and the VMotion Summary & Top N (Data) report will display 3 additional tables. Each of these bar charts/tables will indicate the following:
- The ESX servers to which VMs have been migrated the maximum number of times;
- The ESX servers to which the highest number of successful migrations have been performed;
- The ESX servers to which the largest number of migrations failed;
Besides detecting failed migration attempts, this information enables you to identify ESX hosts that are healthy.
In case of the VMotion Summary & Top N (Graph) report, clicking on any division in any bar graph will allow you to zoom into the details of the migrations of that type for that ESX server.
In case of the VMotion Summary & Top N (Data) report, clicking on any target Host in the target-related sections will allow you to view the complete details of all the migrations for which that host was the target.
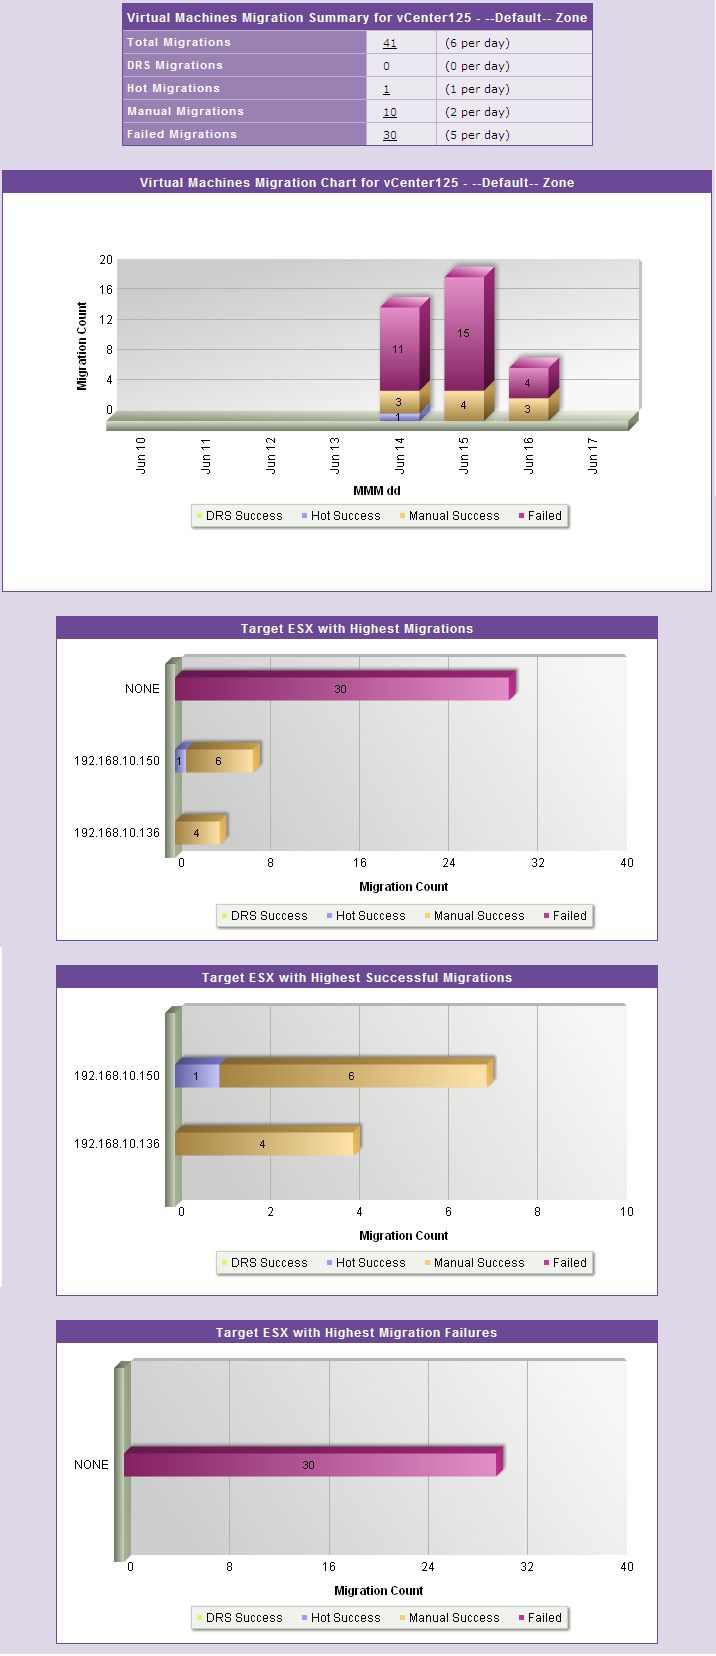
Figure 11 : The VMotion Summary Graph report if the Target ESX option is chosen from the Summary list
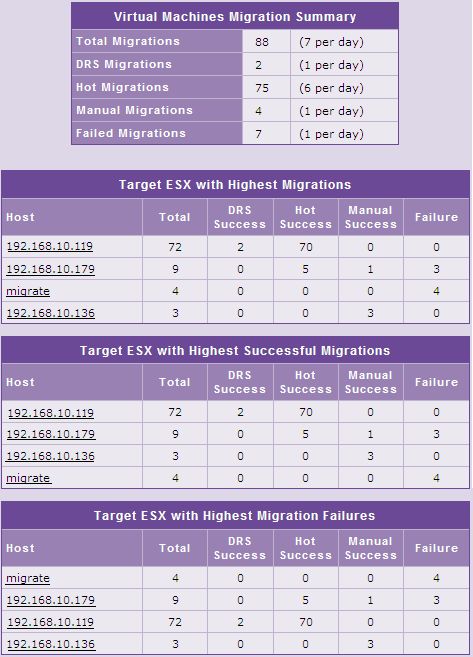
Figure 12 : The VMotion Data Report if the Target ESX option is chosen from the Summary list
-
With the Show Details flag set to Yes, if you pick the Source Cluster option from the Summary list, then, the VMotion Summary & Top N (Graph) report will additionally display 3 bar charts, and the VMotion Summary & Top N (Data) report will display 3 additional tables. Each of these bar charts/tables will indicate the following:
- The clusters from which VMs have been migrated the maximum number of times;
- The clusters from which the highest number of successful migrations have been performed;
- The clusters to which the largest number of migrations failed;
Besides detecting failed migration attempts, this information enables you to identify unhealthy clusters.
In case of the VMotion Summary & Top N (Graph) report, clicking on any division in any bar graph will allow you to zoom into the details of the migrations of that type for that cluster.
In case of the VMotion Summary & Top N (Data) report, clicking on a Source Cluster in the source-related sections will enable you to view a VMotion Details report pertaining to that cluster.
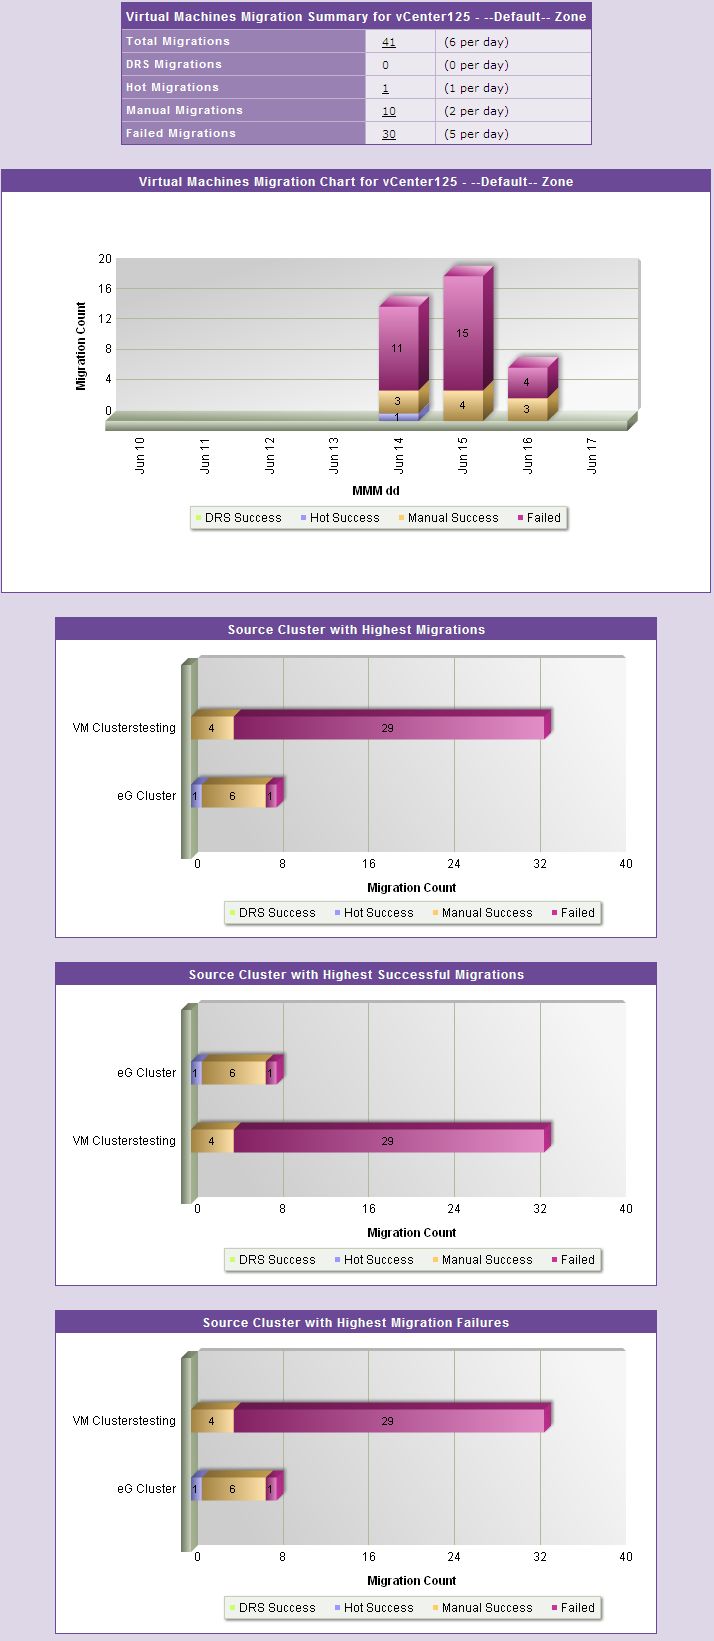
Figure 13 : The VMotion Summary Graph report if the Source Cluster option is chosen from the Summary list
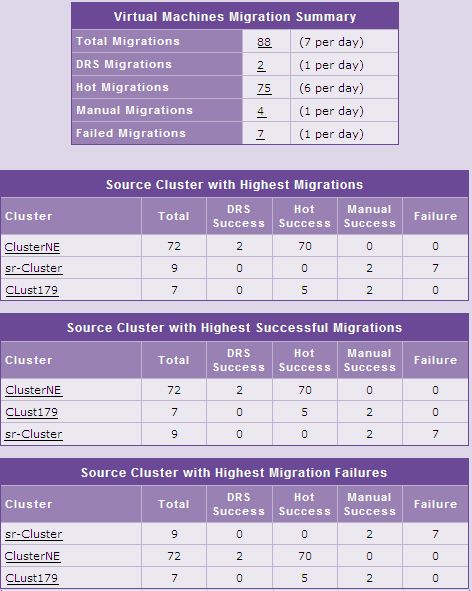
Figure 14 : The VMotion Data Report if the Source Cluster option is chosen from the Summary list
-
If you select the Target Cluster option from the Summary list, and set the Show Details flag to Yes, then, the VMotion Summary & Top N (Graph) report will additionally display 3 bar charts, and the VMotion Summary & Top N (Data) report will display 3 additional tables. Each of these bar charts/tables will indicate the following:
- The clusters to which VMs have been migrated the maximum number of times;
- The clusters to which the highest number of successful migrations have been performed;
- The clusters to which the largest number of migrations failed;
Besides detecting failed migration attempts, this information enables you to identify clusters that are healthy.
In case of the VMotion Summary & Top N (Graph) report, clicking on any division in any bar graph will allow you to zoom into the details of the migrations of that type for that cluster.
In case of the VMotion Summary & Top N (Data) report, clicking on any a target Cluster in the target-related sections will allow you to view the VMotion Details report revealing the details of all migrations made to that cluster.
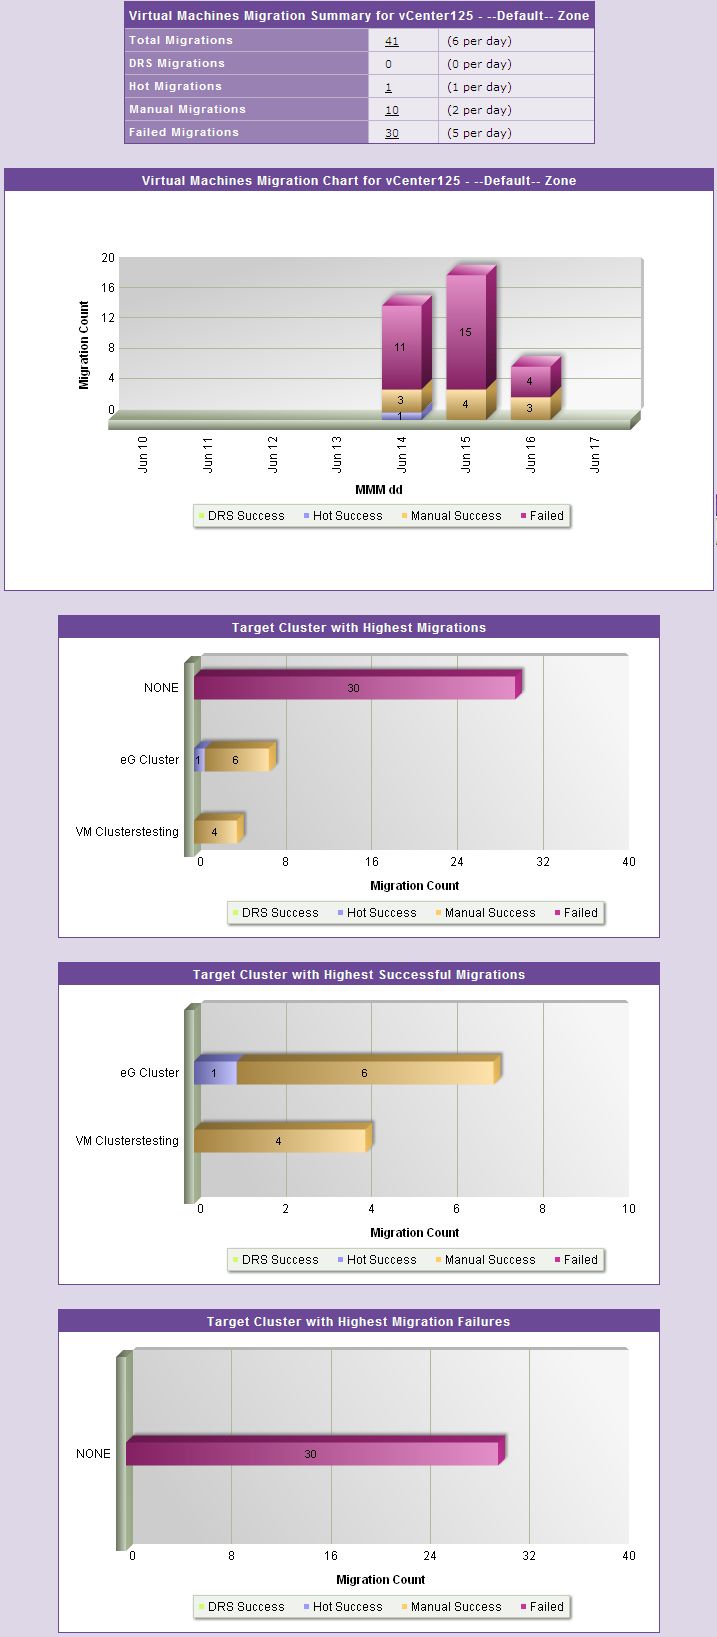
Figure 15 : The VMotion Summary Graph report if the Target ESX option is chosen from the Summary list
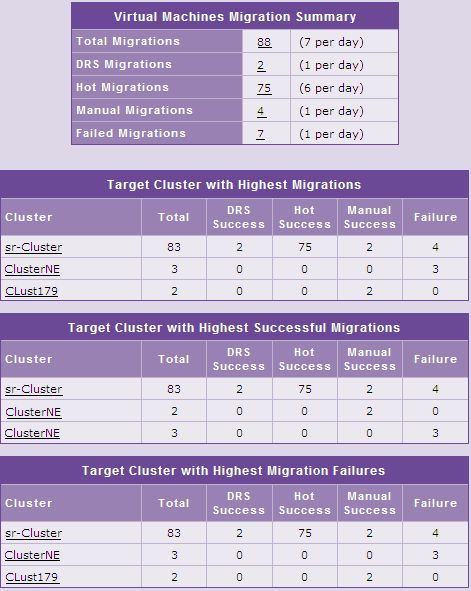
Figure 16 : The VMotion Data Report if the Target ESX option is chosen from the Summary list
VMotion Details Report
In addition to providing a macro view of the migration activity performed by chosen vCenter servers, the VMotion Details report provides detailed information pertaining to every migration, thus shedding light on the following:
- Which ESX servers and/or clusters has a VM ‘visited’ during the given period?
- When did every migration occur?
- Where is the VM currently located?
- Which migration attempt failed and why?
To generate this report, do the following:
-
Select VMotion from the Virtualization node of the REPORTS BY FUNCTION tree in the eG Reporter.
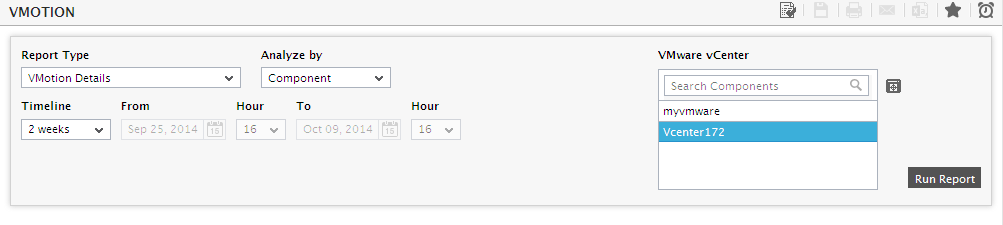
- When Figure 17 page appears, first, indicate the Report Type. Set VMotion Details as the Report Type.
-
Next, from the VMware vCenter list, select the vCenter server(s) for which the migration report is to be generated. By default, all the managed vCenter servers in your environment will be listed here. This is because, the default selection from the Analyze by list is Component. You can however narrow your search by opting to view only those vCenter servers that are part of a service/segment/zone in the VMware vCenter list. For this, select the Zone, Service, or Segment, option from the Analyze by field:
- Selecting the Zone option will allow you to select the desired zone from the Zone list box. To include the vCenter servers within a specific subzone also in the VMware vCenter list, set the Include subzone flag to Yes.
- In the same way, to make the vCenter servers that are part of a particular segment or service available for selection in the VMware vCenter list, select Service or Segment from the Analysis By list box. Then, select the desired service or segment from the Service or Segment list.
- If the VMware vCenter list consists of too many vCenter servers, then viewing all the components and selecting the ones you need for report generation could require endless scrolling. To avoid this, you can click the button next to the VMware vCenter list. The VMWARE VCENTER pop up window will then appear using which you can view almost all the vCenter servers in a single interface and select the ones for which the report is to be generated.
-
Then, specify the Timeline for the graph. You can either provide a fixed time line such as 1 hour, 2 days, etc., or select the Any option from the list to provide a From and To date/time for report generation. By default, 1 day will be selected from the Timeline list box.
Note:
For every user registered with the eG Enterprise system, the administrator can indicate the maximum timeline for which that user can generate a report. Once the maximum timeline is set for a user, then, whenever that user logs into eG Reporter and attempts to generate a report, the Timeline list box in the report page will display options according to the maximum timeline setting of that user. For instance, if a user can generate a report for a maximum period of 3 days only, then 3 days will be the highest option displayed in the Timeline list - i.e., 3 days will be the last option in the fixed Timeline list. Similarly, if the user chooses the Any option from the Timeline list and proceeds to provide a start date and end date for report generation using the From and To specifications, eG Enterprise will first check if the user's Timeline specification conforms to his/her maximum timeline setting. If not, report generation will fail. For instance, for a user who is allowed to generate reports spanning over a maximum period of 3 days only, the difference between the From and To dates should never be over 3 days. If it is, then, upon clicking the Run Report button a message box will appear, prompting the user to change the From and To specification.
-
In addition to the settings discussed above, this report comes with a set of default specifications. These settings are hidden by default. If you do not want to disturb these default settings, then you can proceed to generate the report by clicking the Run Report button soon after you pick one/more VMware vCenter servers. However, if you want to view and then alter these settings (if required), click on the
button. The default settings will then appear in the MORE OPTIONS drop down window (see Figure 18). The steps below discuss each of these settings and how they can be customized.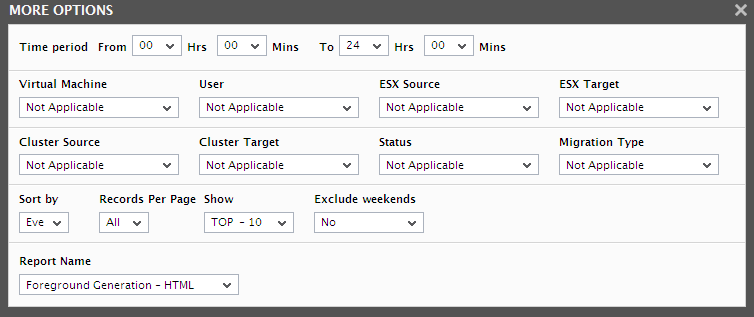
Figure 18 : The default settings for generating the VMotion Details report
- Next, indicate the report Time period. By default 00 Hr and 24 Min, 24 Hr and 00 Min will be selected in the From and To fields.
-
If the timeline specified for the report needs to exclude the data collected during the Weekends, then set Exclude weekends to Yes. If not, select No.
Note:
By default, the weekend constitutes Saturday and Sunday. To override this default setting, do the following:
- Edit the eg_report.ini file in the <EG_INSTALL_DIR>\manager\config directory.
- In the [VIRTUAL_CENTER] section of the file, the EXCLUDE_WEEKEND parameter is set to Saturday,Sunday by default. You can modify this by setting the EXCLUDE_WEEKEND parameter to a comma-separated list of other days of the week - say Friday,Saturday.
- Save the file after making the required changes.
- By default, this report provides details of the migrations related to all the VMs managed by the chosen vCenter servers. Accordingly, the All option is chosen by default in the Virtual Machine list. To view a report pertaining to a particular VM instead, select a specific VM from the Virtual Machine list.
- To view a report on migrations that were initiated by a specific user, select the user name from the User list box. The default report however pertains to all users; accordingly, the All option is chosen by default from the User list.
- If you want to view a report on VMs that were migrated from a particular ESX server, then select the server from the esx Source list. By default, this report provides the details of migrations from all ESX servers managed by the chosen vCenter server. Accordingly, the All option is chosen by default from the esx Source list.
- For a report on VMs that were moved to a particular ESX server, select the destination server from the esx Target list. By default however, this report focuses on VM migrations to all the ESX servers managed by the selected vCenter servers. Accordingly, the All option is chosen by default from the esx Target list.
- If you want to view a report on VMs that were migrated from a particular cluster, then select the cluster from the Cluster Source list. By default, this report provides the details of migrations from all clusters managed by the chosen vCenter server. Accordingly, the All option is chosen by default from the Cluster Source list.
- For a report on VMs that were moved to a particular cluster, select the destination cluster from the Cluster Target list. By default however, this report focuses on VM migrations to all the clusters managed by the selected vCenter servers. Accordingly, the All option is chosen by default from the Cluster Target list.
- By default, this report provides a summary of all migrations that occurred in an environment, regardless of their status. This explains why the default option chosen from the Status list is All. However, to view a report on the migrations of a particular state, select Success or Failure from the Status list.
-
Similarly, you can configure the report to provide the details of migrations of a particular type, by selecting one of the following types from the Migration Type list:
- DRS: Refers to DRS-recommended migrations
- Hot: Refers to powered-on virtual machines moved from one server to another
- Manual: Refers to powered-off or suspended virtual machines moved from one server to another
By default however, this report provides details of all types of migrations; accordingly, the All option is chosen by default from the Migration Type list.
- By default, this report displays only 10 records per page. To view a more or a less number of records in every page, select a different number from the Records Per Page list box.
- By default, this report is sorted in the descending order of the date and time at which each migration occurred. Accordingly, the Event Time option is chosen by default from the Sort By list. To change the sort order, pick a different option from the Sort By list.
- By default, this report displays only the details of the top-10 migrations, based on the chosen sort order. Accordingly, the Show list is set to top-10 by default. To change the ‘N’ in ‘Top-N’ or ‘Last-N’, pick a different ‘Top’ or ‘Last’ option from the Show list.
- For instance, if the Show option is top-10 and the Sort By option is Event Time, then this report will display only the top-10 most recent migration events. Similarly, if the Show option is top-10 and the Sort By option chosen is Virtual Center, Virtual Machine, vm Source, VM Target, Cluster Source, or Cluster Target, then, the report first sorts the migration records in the alphabetical order of the Virtual Center names, VM names, ESX server names, or cluster names (as the case may be), and then displays only the top-10 records of the sorted list.
- On the other hand, if the Show list is set to Top-10 and the Sort By option chosen is Success, then the report first arranges all successful migration events in the ascending order of their migration types (DRS, Hot, Manual), and then displays only the top-10 records of the sorted list. Likewise, if the Sort By option chosen is Failure, then the report first arranges all the failed migration events in the descending order of their migration types (Manual, Hot, DRS), and then, displays only the top-10 records of this list.
-
In large environments, reports generated using months of data can take a long time to complete. Administrators now have the option of generating reports on-line or in the background. When a report is scheduled for background generation, administrators can proceed with their other monitoring, diagnosis, and reporting tasks, while the eG manager is processing the report. This saves the administrator valuable time. To schedule background processing of a report, select the Background Save - PDF option from the Report Generation list. In this case, a Report Name text box will appear, where you would have to provide the name with which the report is to be saved in the background. To process reports in the foreground, select the Foreground Generation - HTML option from this list.
Note:
- The Report Generation list will appear only if the EnableBackgroundReport flag in the [BACKGROUND_PROCESS] section of the eg_report.ini file (in the [EG_INSTALL_DIR]\manager\config directory) is set to Yes.
- The default selection in the Report Generation list will change according to the Timeline specified for the report. If the Timeline set is greater than or equal to the number of days specified against the MinDurationForReport parameter in the [BACKGROUND_PROCESS] section of the eg_report.ini file, then the default selection in the Report Generation list will be Background. On the other hand, if the Timeline set for the report is lesser than the value of the MinDurationForReport parameter, then the default selection in the Report Generation list will be Foreground. This is because, the MinDurationForReport setting governs when reports are to be processed in the background. By default, this parameter is set to 2 weeks - this indicates that by default, reports with a timeline of 2 weeks and above will be processed in the background.
- Finally, click on the Run Report button.
-
If the Report Generation mode is Foreground Generation - html, then, clicking the Run Report button will display a Virtual Machine Migration Summary that provides an overview of the migration activity that occurred during the specified Timeline. Below this table you will find a Virtual Machines Migration Details section that provides elaborate details of every VM migration that took place in the environment during the given period. These details include the following:
- The Virtual Center that manages the VM that was migrated;
- The Event Time - i.e., the date and time at which the migration event took place;
- The Virtual Machine that was migrated;
- The Source ESX server from which the VM was migrated;
- The Target ESX server to which the VM was moved;
- The User who initiated the migration;
- The Datacenter involved in the migration;
- The Source Cluster from which the VM was migrated;
- The Target Cluster to which the VM was migrated;
- Whether the migration was a Success or not - displays y if the migration was successful, and n if it failed;
- The Migration Type - D for DRS migrations, h for Hot migrations, and m for Manual migrations;
-
A brief Description of the status of the migration activity - in case of a failed migration, this Description will indicate the reasons for the failure;
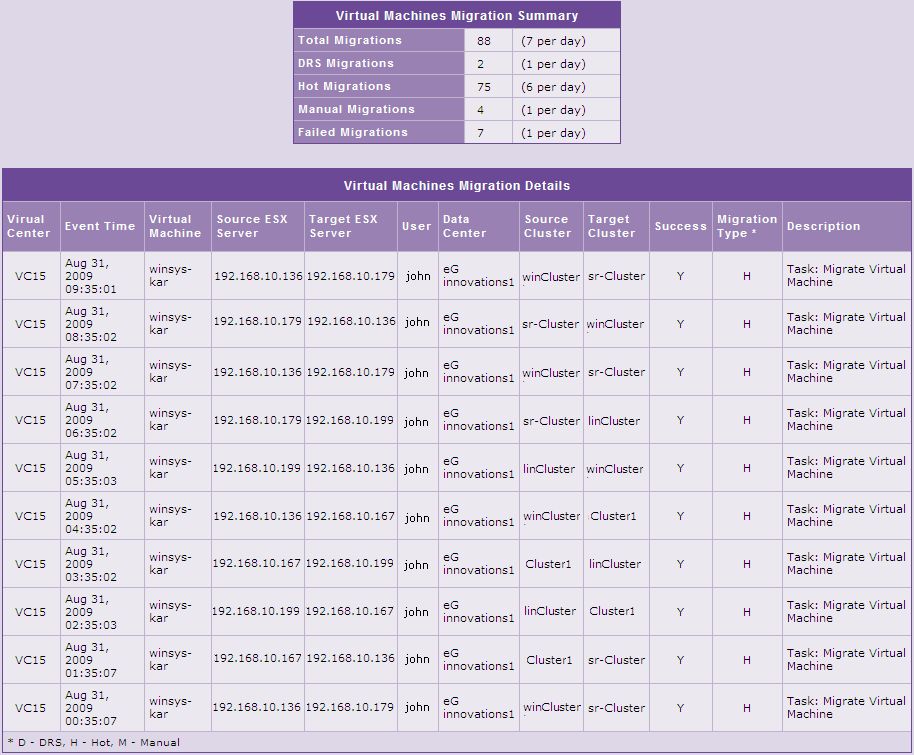
Figure 19 : The VMotion Details report
- On the other hand, if the Background Save - PDF option is chosen from the Report Generation list, then clicking on the Run Report button will not generate the report and display it in this page for your benefit. Instead, a message indicating that the report is being processed in the background will appear. This will be accompanied by a link that will lead you to the page that lists all the reports that are being processed in the background, and their current status. If background report generation fails for a report, you can regenerate that report using this page, or can even delete that report if need be. On the other hand, if background processing successfully completes for your report, then, you can view a PDF of the report by clicking on the
 icon in that page.