eG Database Analysis Report
One of the key challenges faced by administrators when using the eG monitoring system is making sure that the eG database is sized correctly and does not run out of space at any point in time. Some of the common causes for a space crunch in the eG database include poor capacity planning resulting in insufficient space allocation to the database, and abnormal database growth owing to irregular cleanup and inefficient database maintenance. The shortage of space in the eG database often has serious repercussions:
-
The eG database may not be able to store real-time performance measures collected by the agents. As a result, eG will not be able to alerts users to problem conditions; troubleshooting becomes a nightmare, support costs escalate, and infrastructure downtime increases;
-
Without enough space to store even raw measures, trend computation and storage of trend data becomes impossible; hence, reports cannot be generated, performance cannot be historically analyzed, and potential problems cannot be predicted;
-
Organizations may be forced to unnecessarily splurge money on additional hardware to quickly resolve the space crisis;
To prevent such eventualities, administrator should continuously keep track of the growth of the eG database to proactively detect and if possible, avert, abnormal growth in database size. For this purpose, eG Enterprise offers the eG Database Analysis report.
By generating this report, administrators can identify the growth rate of the eG database over a period of time. Besides, the growth rate of the large tables in the eG database is also revealed. This statistics helps administrators in identifying tables that may require additional storage space. In addition, administrators can know that there may be an issue with preset clean up activities when the growth rate of the database is abnormal.
To generate this report, do the following:
-
Select the eG Database Analysis option by following the menu sequence: REPORTS BY FUNCTION -> Domain-specific Reports ->eG Enterprise.
-
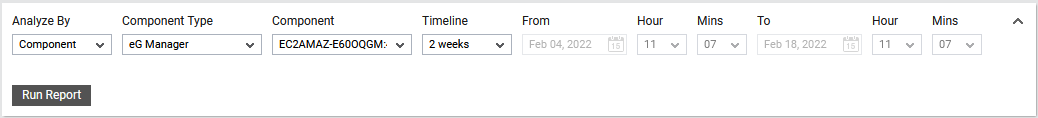
Using this report, you can analyze the database growth of one/more managed eG manager components, or those that are part of a zone, service or segment. The options provided by the Analyze By list box are discussed hereunder:
- Component: Select this option to choose the component(s) from across all the managed components in the environment.
- Zone: To generate a report for one/more components that are included in a zone, pick the Zone option. A Zone drop-down list will then appear, from which you would have to select the zone to which the components of interest to you belong. A Sub zone flag also appears. Indicate whether the components present within the sub-zones of the chosen zone are also to be to be considered for report generation, by setting the Sub zone flag to Yes.
- Segment: If you want to generate a report for one/more chosen components that belong to a segment, select the Segment option from Analyze By list box, and then pick the Segment from the drop-down list that appears.
- Service: If you want to generate a report for one/more components involved in the delivery of a service, select the Service option from Analyze By, and then pick the required Service from the drop-down list that appears.
- Next, select eG manager as the component type from the Component Type list box.
-
Then, specify the Timeline for generating this report. You can either provide a fixed time line such as 1 hour, 2 days, etc., or select the Any option from the list to provide a From and To date/time for report generation.
Note:
For every user registered with eG Enterprise, the administrator can indicate the maximum timeline for which that user can generate a report. Once the maximum timeline is set for a user, then, whenever that user logs into eG Reporter and attempts to generate a report, the Timeline list box in the report page will display options according to the maximum timeline setting of that user. For instance, if a user can generate a report for a maximum period of 3 days only, then 3 days will be the highest option displayed in the Timeline list - i.e., 3 days will be the last option in the fixed Timeline list. Similarly, if the user chooses the Any option from the Timeline list and proceeds to provide a start date and end date for report generation using the From and To specifications, eG Enterprise will first check if the user's Timeline specification conforms to his/her maximum timeline setting. If not, report generation will fail. For instance, for a user who is allowed to generate reports spanning over a maximum period of 3 days only, the difference between the From and To dates should never be over 3 days. If it is, then, upon clicking the Run Report button a message box will appear, prompting the user to change the From and To specification.
-
In addition to the settings discussed above, this report comes with a set of default specifications. These settings are hidden by default. If you do not want to disturb these default settings, then you can proceed to generate the report by clicking the Run Report button soon after you pick a Component. However, if you want to view and then alter these settings (if required), click on the
 button. The default settings will then appear in the MORE OPTIONS drop down window (see Figure 2). The steps below discuss each of these settings and how they can be customized.
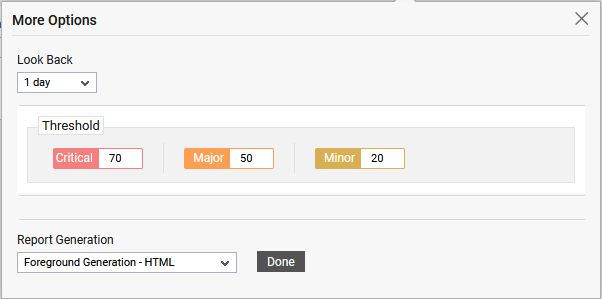
Figure 2 : The default settings for generating the eG Database Analysis report
-
By default, 1 day is chosen from the Look Back drop down list. This indicates that the change in growth rate of the database tables in the generated report is calculated by comparing the table size at the time of report generation with the table size prior to 1 day. For example, if you are generating this report on March 11, 2022 at 17.30 hours, then the table size during the past 24 hours (March 10, 2022 to March 11, 2022 17.30 hours) will be compared with the table size reported on March 9, 2022 at 17.30 hours. You can select the timeline of your interest to calculate the change in growth rate. Similarly, if you have chosen 3 days from this list, then, the report will compare the current table size reported on between March 10, 2022 17.30 hours and March 11, 2022 17.30 hours with the table size reported on March 7, 2022 17.30 hours. You can choose a look back period of upto 1 month from this list.
- The Threshold section in Figure 2 allows you to set the Critical, Major and Minor thresholds. The thresholds are provided in unique color-coded text boxes. In these text boxes, starting from left to right, set the threshold in percentage beyond which the database growth should be termed as 'high' in the Critical/Major/Minor format. By default, 70/50/20 percentage is displayed against this field.
-
In large environments, reports generated using months of data can take a long time to complete. Administrators now have the option of generating reports on-line or in the background. When a report is scheduled for background generation, administrators can proceed with their other monitoring, diagnosis, and reporting tasks, while the eG manager is processing the report. This saves the administrator valuable time. To schedule background processing of a report, you can either select the Background Save - PDF option or the Background Save - CSV option from the Report Generation list. In this case, a Report Name text box will appear, where you would have to provide the name with which the report is to be saved in the background. To process reports in the foreground, select the Foreground Generation - HTML option from this list.
Note:
- The Report Generation list will appear only if the EnableBackgroundReport flag in the [BACKGROUND_PROCESS] section of the eg_report.ini file (in the [EG_INSTALL_DIR]\manager\config directory) is set to Yes.
- The default selection in the Report Generation list will change according to the Timeline specified for the report. If the Timeline set is greater than or equal to the number of days specified against the MinDurationForReport parameter in the [BACKGROUND_PROCESS] section of the eg_report.ini file, then the default selection in the Report Generation list will be Background Save - PDF. On the other hand, if the Timeline set for the report is lesser than the value of the MinDurationForReport parameter, then the default selection in the Report Generation list will be Foreground. This is because, the MinDurationForReport setting governs when reports are to be processed in the background. By default, this parameter is set to 2 weeks - this indicates that by default, reports with a timeline of 2 weeks and above will be processed in the background.
- Finally, click the Run Report button.
-
If the Report Type is Graph and the Report Generation mode is Foreground Generation - HTML, then, clicking on the Run Report button will reveal Figure 3.
-
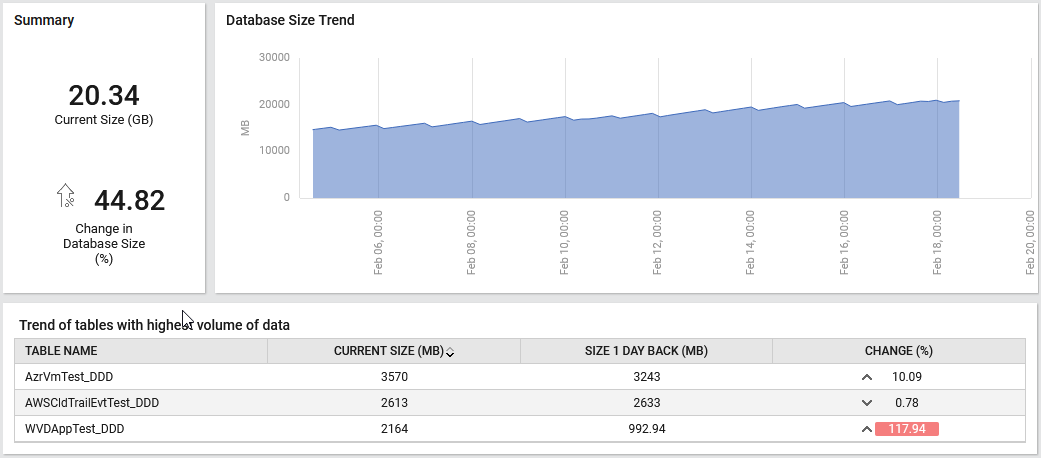
Figure 3 comprises of the following:
- ASummary section reveals the current size of the eG database and displays the rate of change in database growth over a period of time.
- Adjacent to the Summary section, you will find a Database Size Trend section that graphically represents utilization of database space over a period of time. This section helps administrators identify when the database utilization was at peak over a period of time. A consistently high utilization of database space is an indication for the administrators to free up space on the database by cleaning up unwanted data or increase the database space.
-
The Trend of tables with highest volume of data section reveals the name of the top-10 tables that are consuming a huge volume of data. This section reveals the current size of each table, the size that had grown in comparison with the size on the day chosen from the Look Back list and the rate of change in the database size with respect to the size on the day chosen from the Look Back list. Based on the thresholds chosen from the MORE OPTIONS drop down, the Change% column highlights the values for those tables that have exceeded the set thresholds. This way, administrators can merely look at a glance to identify those tables that are about to exhaust their physical resources.
-
On the other hand, if the Background Save - PDF option is chosen from the Report Generation list, then clicking on the Run Report button will not generate the report and display it in this page for your benefit. Instead, a message indicating that the report is being processed in the background will appear. This will be accompanied by a link that will lead you to the page that lists all the reports that are being processed in the background, and their current status. If background report generation fails for a report, you can regenerate that report using this page, or can even delete that report if need be. On the other hand, if background processing successfully completes for your report, then, you can view a PDF of the report by clicking on the
 icon in that page.