eG Manager Health Report
To determine at-a-glance how healthy the eG manager has been over a chosen time period and to quickly and accurately pinpoint performance ‘hot spots’, you can use the new eG Manager Health report that eG Enterprise offers. This report when generated, runs a pre-configured set of health checks – i.e., rules - on the eG Manager. If even a single rule had failed in the given timeline, the report marks the eG manager’s health as ‘Not OK’. Using the report, you can also identify the exact rules that failed. This way, you can accurately isolate the problem-prone KPIs of eG manager performance.
To generate the eG Manager Health report, do the following:
- Select the eG Manager Health option from the Domain-specific Reports node of the REPORTS BY FUNCTION tree.
-
Figure 1 will then appear.
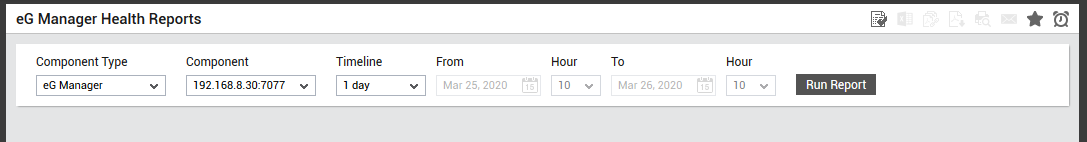
Figure 1 : Specifying the criteria for generating the eG Manager Health Report
-
By default, the eG Manager option will be chosen from the Component Type list.
- The Component list will be populated with the component that is managed in your environment for the chosen component type, by default.
-
Then, specify the Timeline for the generating the report. You can either provide a fixed time line such as 1 hour, 2 days, etc., or select the Any option from the list to provide a From and To date/time for report generation.
Note:
For every user registered with the eG Enterprise system, the administrator can indicate the maximum timeline for which that user can generate a report. Once the maximum timeline is set for a user, then, whenever that user logs into eG Reporter and attempts to generate a report, the Timeline list box in the report page will display options according to the maximum timeline setting of that user. For instance, if a user can generate a report for a maximum period of 3 days only, then 3 days will be the highest option displayed in the Timeline list - i.e., 3 days will be the last option in the fixed Timeline list. Similarly, if the user chooses the Any option from the Timeline list and proceeds to provide a start date and end date for report generation using the From and To specifications, eG Enterprise will first check if the user's Timeline specification conforms to his/her maximum timeline setting. If not, report generation will fail. For instance, for a user who is allowed to generate reports spanning over a maximum period of 3 days only, the difference between the From and To dates should never be over 3 days. If it is, then, upon clicking the Run Report button a message box will appear, prompting the user to change the From and To specification.
-
In addition to the settings discussed above, this report comes with a set of default specifications. These settings are hidden by default. If you do not want to disturb these default settings, then you can proceed to generate the report by clicking the Run Report button soon after you pick the component for report generation. However, if you want to view and then alter these settings (if required), click on the
 icon. The default settings will then appear in the MORE OPTIONS drop down window (See Figure 2). The steps below discuss each of these settings and how they can be customized.
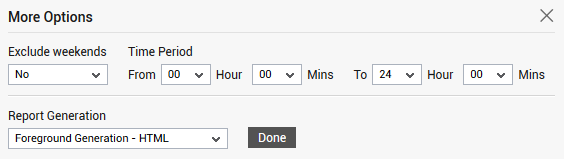
-
If the timeline specified for the report needs to exclude the data collected during the Weekends, then set Exclude weekends to Yes. If not, select No.
Note:
By default, the weekend constitutes Saturday and Sunday. To override this default setting, do the following:
- Edit the eg_report.ini file in the <EG_INSTALL_DIR>\manager\config directory.
- In the [EXCLUDE_WEEKEND] section of the file, the Days parameter is set to Saturday,Sunday by default. You can modify this by setting the Days parameter to a comma-separated list of other days of the week - say Friday,Saturday.
- Save the file after making the required changes.
-
Next, indicate the report Timeperiod.
Note:
By default, the Timeperiod is set to 24 hours. Accordingly, the From and To parameters in the [timeframe] section of the eg_report.ini file (in the <eg_install_dir>\manager\config directory) are set to 00:00 and 24:00 respectively. If need be, you can override this default setting by configuring a different timeframe against the From and/or To parameters.
-
In large environments, reports generated using months of data can take a long time to complete. Administrators now have the option of generating reports on-line or in the background. When a report is scheduled for background generation, administrators can proceed with their other monitoring, diagnosis, and reporting tasks, while the eG manager is processing the report. This saves the administrator valuable time. To schedule background processing of a report, you can either select the Background Save - PDF option from the Report Generation list. In this case, a Report Name text box will appear, where you would have to provide the name with which the report is to be saved in the background. To process reports in the foreground, select the Foreground Generation - HTML option from this list.
Note:
- The Report Generation list will appear only if the EnableBackgroundReport flag in the [BACKGROUND_PROCESS] section of the eg_report.ini file (in the {EG_INSTALL_DIR}\manager\config directory) is set to Yes.
- The default selection in the Report Generation list will change according to the Timeline specified for the report. If the Timeline set is greater than or equal to the number of days specified against the MinDurationForReport parameter in the [BACKGROUND_PROCESS] section of the eg_report.ini file, then the default selection in the Report Generation list will be Background Save - PDF. On the other hand, if the Timeline set for the report is lesser than the value of the MinDurationForReport parameter, then the default selection in the Report Generation list will be Foreground. This is because, the MinDurationForReport setting governs when reports are to be processed in the background. By default, this parameter is set to 2 weeks - this indicates that by default, reports with a timeline of 2 weeks and above will be processed in the background.
- Click the Done button if any changes were made to the More Options drop down window.
- Finally, click the Run Report button to generate the report.
-
If the Report type is Foreground Generation - HTML, then Figure 3 will appear as soon as you click the Run Report button.
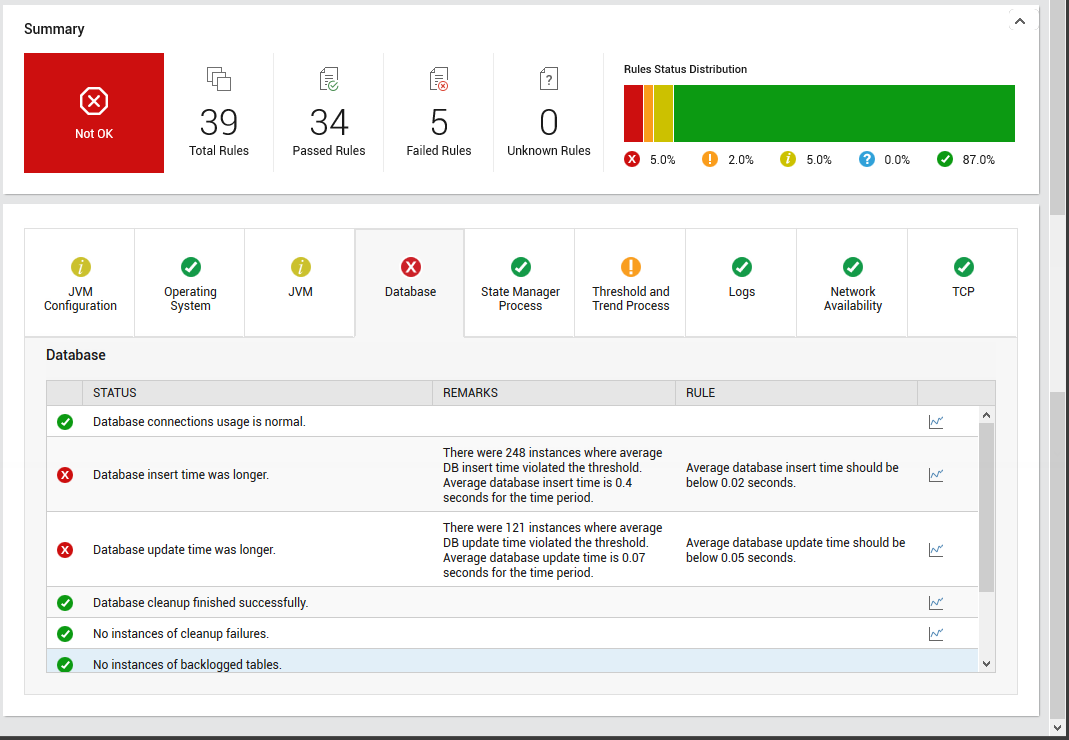
- The Summary section of the report provides an at a glance view of the health of the eG manager. In Figure 3, the health of the eG manager is reported as Not OK. The total number of rules or pre-configured set of health checks that were executed on the eG manager is specified. Administrators can figure out the count of rules that were successful and the count of rules that failed on the eG manager. The Unknown Rules specifies the count of rules that could not be executed since the tests pertaining to the rule did not report metrics in the chosen time period. The Rules Status distribution section specifies the percentage of rules that were in Critical/Major/Minor/Unknown/Normal states. This helps the administrators identify the type of issue that is predominant in the eG manager.
-
The next section reveals the category of rules that were executed on the eG manager. Each category when clicked lists the exact rules that were executed and the status and remarks obtained for the rule. In Figure 3, Critical issues were noticed with respect to the Database. The Database tab when clicked listed all the rules that were executed. Scrolling the list will lead you to the rules that failed. In our case, the Database insert time and the Database update time was longer than normal. The Remarks column lists the number of instances where the threshold violations were noticed with respect the database update time and database insert time. Clicking the
 icon will lead you to Figure 4.
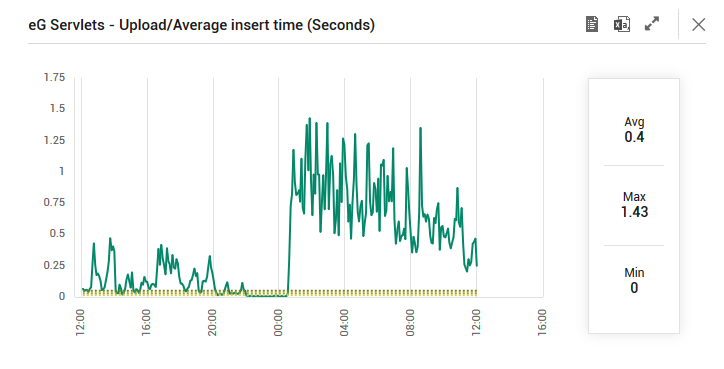
Figure 4 reveals the Measure graph relevant to the rule that failed during the chosen time period. From this graph, administrators can figure out the maximum time taken to insert the data and also figure out the severity of the violation.
- On the other hand, if the Background Save - PDF option is chosen from the Report Generation list, then clicking on the Run Report button will not generate the report and display it in this page for your benefit. Instead, a message indicating that the report is being processed in the background will appear. This will be accompanied by a link that will lead you to the page that lists all the reports that are being processed in the background, and their current status. If background report generation fails for a report, you can regenerate that report using this page, or can even delete that report if need be. On the other hand, if background processing successfully completes for your report, then, you can view a PDF of the report by clicking on the
 icon in that page.