An egsm User’s View
The default user to the Monitor interface of the eG SuperManager is egsm with password egsm. This user has unrestricted rights to the SuperManager, and can view alarms/status information pertaining to all the individual managers that are being managed by the eG SuperManager.
When you login to the SuperManager as egsm, you will be welcomed by the current alarms window (see Figure 1).
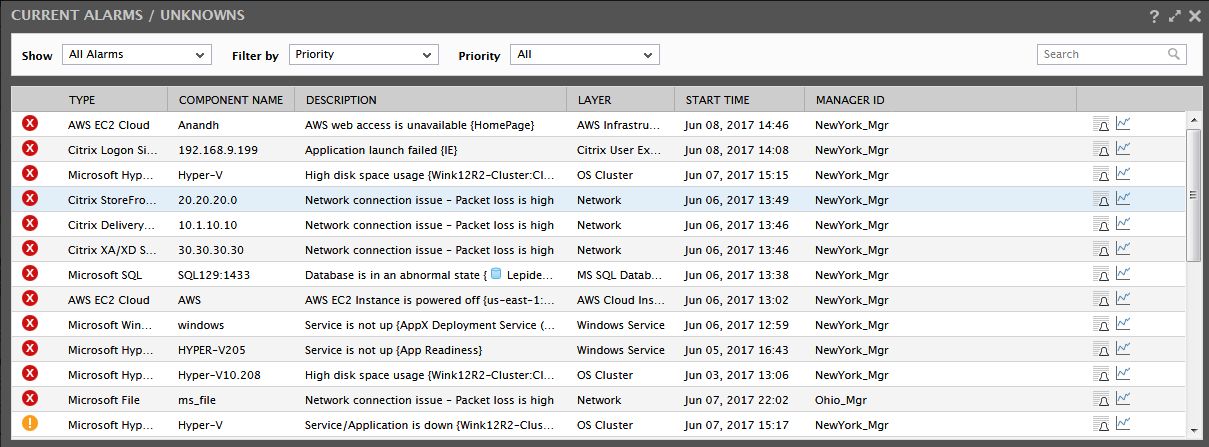
Figure 1 : Consolidated list of alarms pertaining to the Ohio and New York managers
Figure 1 displays the consolidated list of issues encountered by both the New York and Ohio managers. The alarm details include the component type that has suffered performance degradation, the component name, a brief description of the issue, the problem layer, the problem date and time, and the manager that reported the issue. For additional alarm information, simply click on the ![]() icon. Additional details such as the problem test and the service affected will appear as depicted by Figure 2 upon clicking the icon.
icon. Additional details such as the problem test and the service affected will appear as depicted by Figure 2 upon clicking the icon.
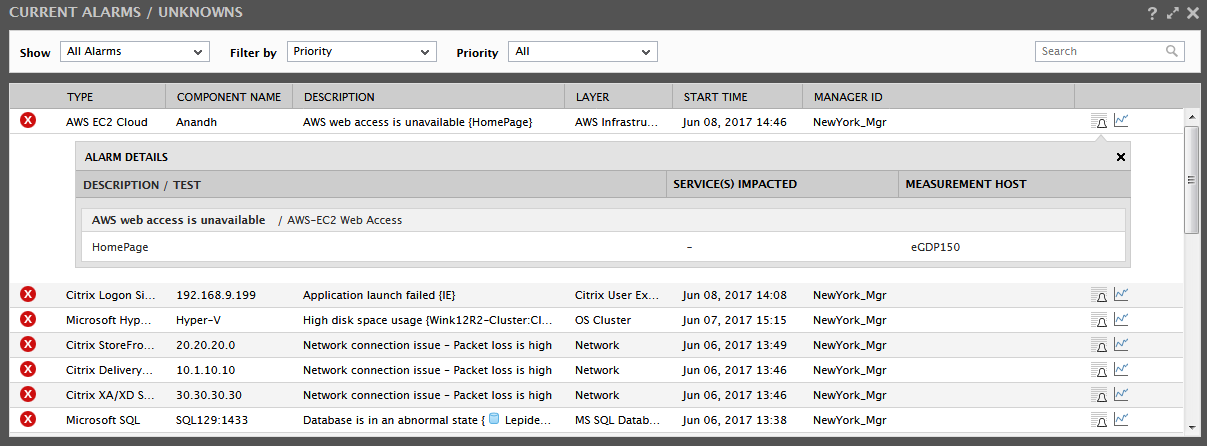
Figure 2 : Additional alarm details
By default, the alarms displayed in the CURRENT ALARMS window are sorted in the descending order of the problem priority and problem date/time. This is why the Filter by list in Figure 2 is set to Priority by default. Typically, the alarms can be sorted in the ascending order of any of the following options – i.e., Component Type, Component Name, Description, Layer, or Start Time.
Also, though the CURRENT ALARMS window displays all the unresolved issues across managers by default, you can choose to view a specific priority of alarms alone by selecting the alarm priority of interest to you from the Priority list. The default selection in the Priority list is All. To view only the critical alarms, select the Critical option from the list. Figure 3 will then appear.
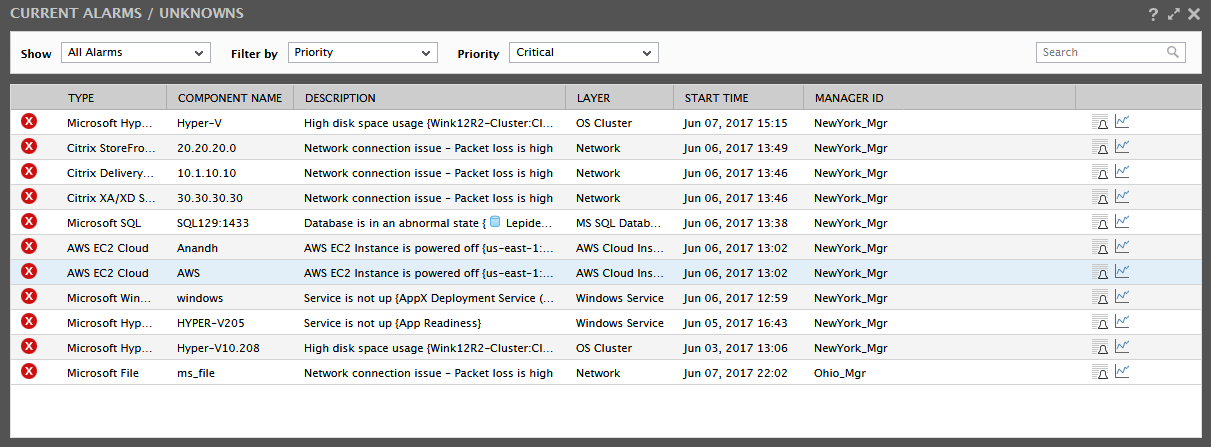
Figure 3 : Viewing the Critical alarms alone
Likewise, you can choose to view Critical & Major alarms, Major alarms alone, or simply the Minor alarms.
Note:
The egsm user does not have either the rights to delete alarms nor possess alarm acknowledgement privileges.
If no alarms exist in the entire infrastructure, then the Monitor Home page is the first page that will be displayed in the monitor interface.
Besides open issues, you can also use the CURRENT ALARMS window to view the tests that are currently in an UNKNOWN state in the environment. A test can switch to an UNKNOWN state when the eG Enterprise system is unable to determine the state of one/more metrics that test reports - this could be because of any of the following reasons:
- The test could have been wrongly configured;
- The eG agent executing the test could have suddenly stopped;
- The eG agent may have been unable to pull out metrics from the server;
- The eG agent executing the test may not be able to transmit the metrics collected by that test to the eG manager, owing to say, poor network connectivity;
To enable administrators to receive a heads-up on the Unknown tests in the environment, so that issues such as the ones mentioned above can be isolated and resolved, the Show list in the left top corner of the CURRENT ALARMS window includes a special Unknowns option.
Selecting the Unknowns option from the Show list invokes Figure 4, where the TESTs in an indeterminate (i.e., UNKNOWN) state, the layers to which the tests are mapped, the names of the components they are associated with, and their corresponding component types will be listed.
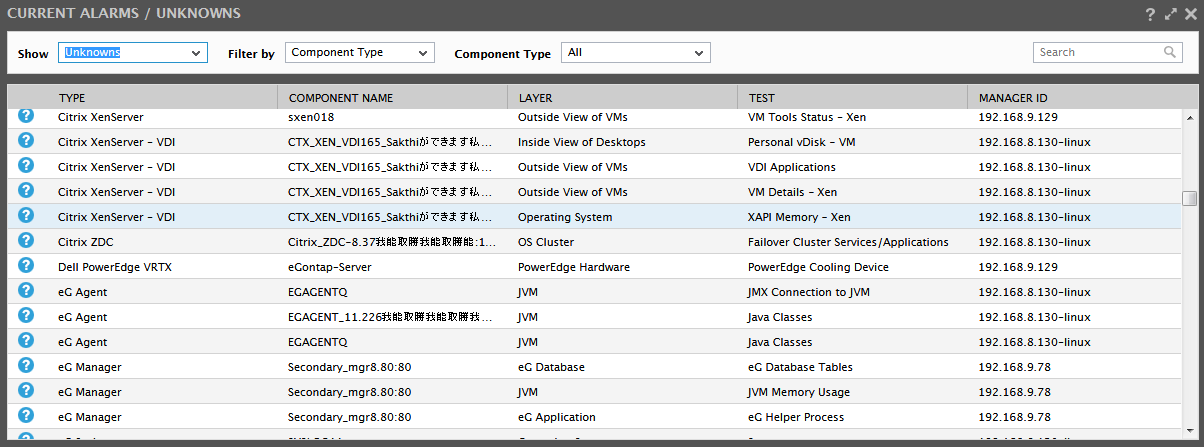
Figure 4 : The components, tests, and metrics in an Unknown state