Auditing Configuration Changes made using the eG SuperManager Monitor Interface
The critical configuration changes made using the eG SuperManager Monitor system can be viewed using the Audits -> Monitor menu sequence. Generally, the monitor configuration changes like allowing alarm deletion, alarm acknowledgment for a particular user etc, can be identified easily and errors, if any can be rectified.
To generate the Monitor related audit log reports, do the following:
-
Follow the menu sequence: Audits -> Monitor. Figure 1 will then appear where you can provide the credentials to generate the report of your choice.
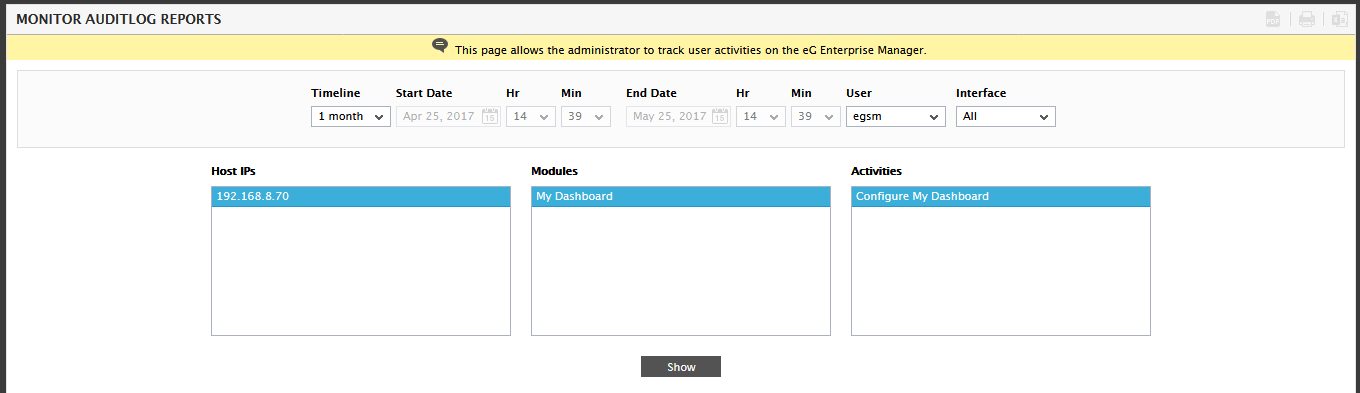
- In Figure 1, select a Timeline for the report. The default Timeline for the report is 24 hours. You can choose any other fixed period from the Timeline list, or select the Any option from this list. Choosing the Any timeline, allows you to provide a Start Date and End Date and time for report generation. You can even choose the exact time using the Hr and Min lists.
- Next, select the User whose monitor activities you want to audit. By default, the egsm option is displayed here, indicating that only the egsm user alone has actively used the eG administrative interface till date. However if more than one user has used the eG SuperManager monitor interface, then All option will be displayed, by default, from the USER list.
- By default, the report displays a maximum of 15 records per page. You can override this default setting, by specifying a different value against the Row_multiplier parameter in the [AUDIT_LOG_SETTINGS] section of the eg_ui.ini file (in the {EG_INSTALL_DIR}\manager\config directory). For instance, if 10 is specified against Row_multiplier, then this report displays 10 records per page.
- The Host IPs list displays all the IP addresses from which the chosen user(s) has accessed the eG monitor interface of the SuperManager. If you are looking for information on the monitor accesses from specific IPs, select those IP addresses alone from the Host IPs list.
- After the selection, the Modules list will be populated with those monitor modules that the chosen user(s) worked with while accessing the eG monitor interface from the selected Host IPs. If you want the details of changes that the user made in specific admin modules, select those modules alone from the Modules list.
- Based on the Modules selection, the Activities list will be populated. While working with the eG SuperManager admin interface, the selected user(s) might have performed a few specific operations on the chosen Modules. eG SuperManager system automatically discovers the operations that correspond to the chosen user-host IP-module combination from the audit logs, and populates the Activities list with the operations so discovered. If you want the details of specific activities only, select the required options alone from the Activities list.
-
Finally, click the Show button to generate the report. Figure 2 will then appear with the generated report.
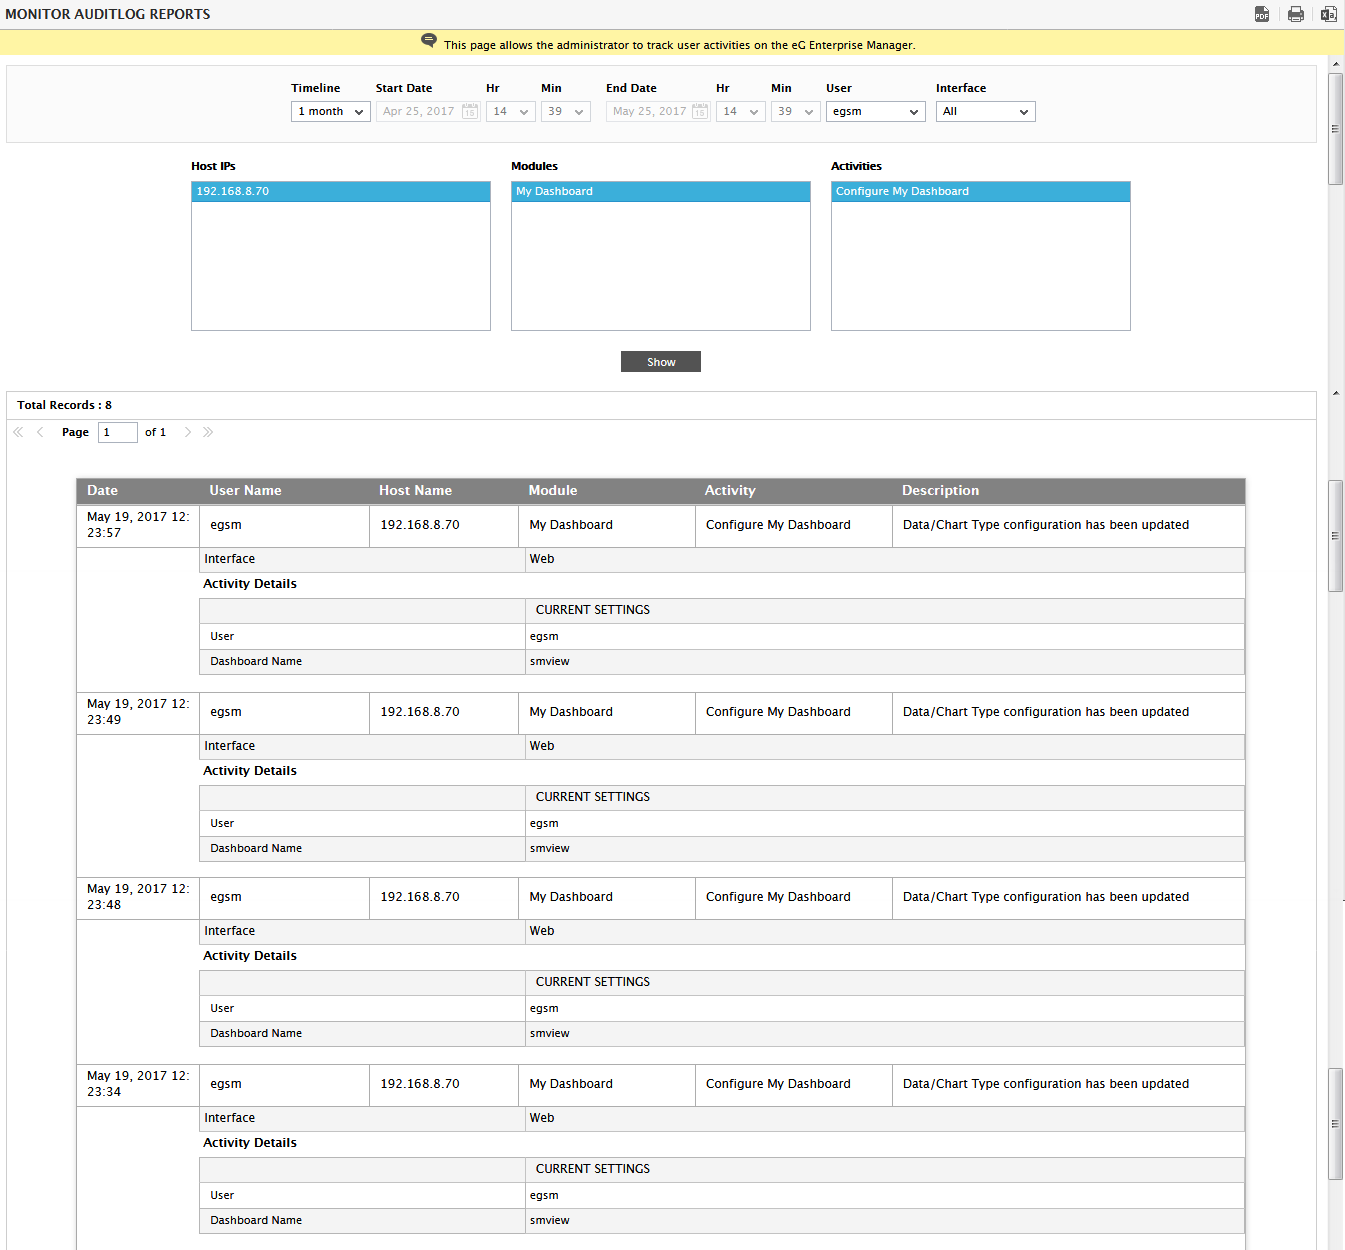
Figure 2 : The auditlog reports for eG SuperManager monitor interface
-
The resulting report as in Figure 2 provides the following details:
- the date/time of the change
- the name of the user who made the change
- the IP address of the host from which the user accessed the eG monitor interface of the SuperManager
- the module that was accessed by the user
- the specific operation/activity that was performed by the user on that module
- the interface type used - whether web interface or command line interface
- the detailed description of the change, followed by a snapshot of the settings prior to change, and the settings after the change; if a configuration has been newly introduced (for e.g., a manager has been newly managed), then only the Current Settings will be displayed.
Note:
- By default, every change record that the report displays will be accompanied by the Current and Previous configuration settings. This can sometimes clutter the report view, making it difficult for you to read and analyze the report. You can therefore hide both these columns from the report, by setting the ShowChanges parameter in the [AUDIT_LOG_SETTINGS] section of the eg_ui.ini (in the {EG_INSTALL_DIR>\manager\config directory) file to No.
- In a redundant setup, the auditlog report will have an additional MANAGER NAME column, which displays the IP or host name of the manager to which a record pertains.
- If the report runs across pages, then the Page box and the >, >>, <, and << links at the bottom of the page will aid navigation.
-
You can print the report by clicking on the
 icon in Figure 2, or save the report as a PDF file by clicking on the
  icon. You can even save the report as a CSV file by clicking on the
  icon in Figure 2.