The Monitor Home Page
Behind the CURRENT alarms window is the monitor home page (see Figure 5). If no alarms exist in the environment, then this is the first page that will be displayed in the monitor interface for the egsm user.
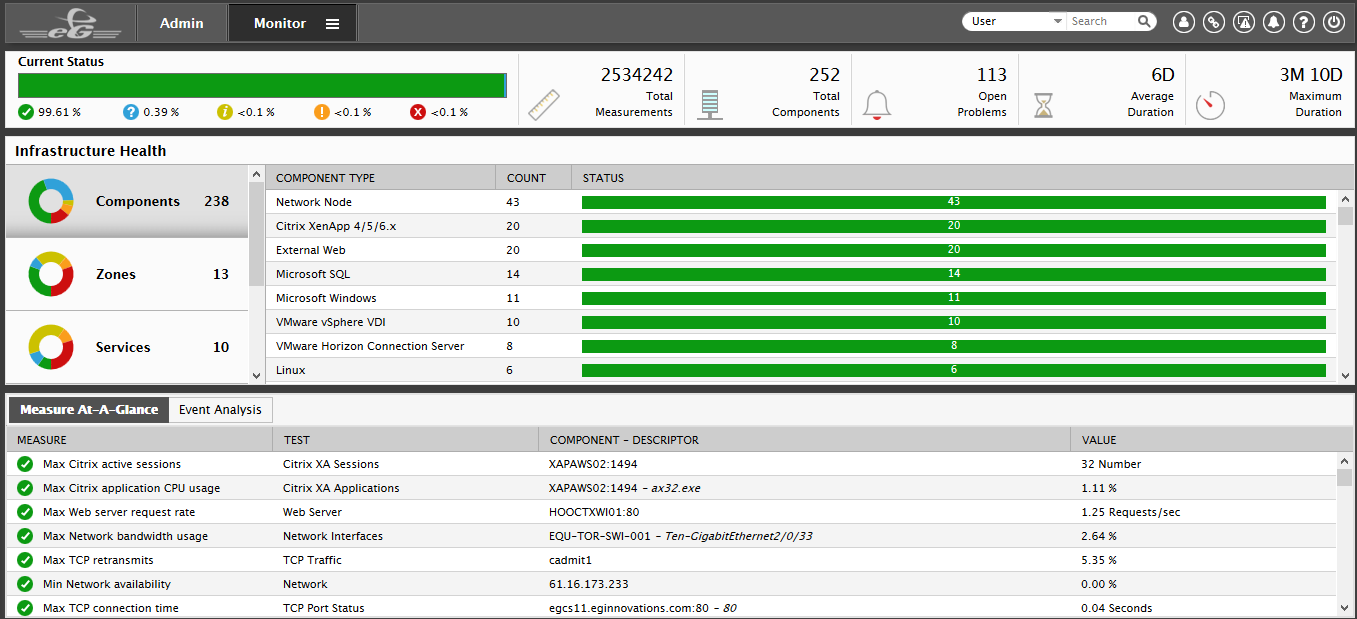
Figure 5 : The Monitor Home page
This page quickly updates the egsm user with the overall health of his/her monitored environment. The page reveals the following information:
- The first section is the Current Status section that reveals at a glance, the status of the measurements reported to all the eG managers reproting to the eG SuperManager. Besides displaying the total number of monitored components and the number of performance metrics collected by the eG agents from these components, this section also reveals the percentage of total measurements that are in the critical, major, minor, normal, and unknown states. Using this information, an accurate assessment of the overall infrastructure performance can be made. Clicking on any of the states will take you to the Current Alarms window, where you can view all open alarms of the corresponding priority.
- Below the Current Status section, is the section that reveals the Infrastructure Health. Since the health of an infrastructure depends entirely upon the performance of each of its key ingredients - namely, the Components, Zones, Services, Service Groups and Segments - this section takes the help of a doughnut graph to clearly indicate the number of zones, services, service groups, segments, and components that are in the Critical, Major, Minor, Normal, and/or Unknown states. Clicking on a doughnut graph will reveal the complete list of components/services/segments/zones/Aggregate Components in the section right to it in a context sensitive manner.
-
Below the Infrastructure Health section you will find a Measures At-A-Glance section that provides the min/max values of critical measurements updated in real-time.
Using the information provided by the Measures At-A-Glance section, the egsm user can receive instant status updates on sensitive performance parameters, and can also accurately determine, at a glance, the component on which the parameter is currently experiencing issues (if any), thereby simplifying problem identification.
The Event Analysis tab page, when clicked, lists the top-5 layers that were most affected by performance issues.
Corresponding to every layer name in the Event Analysis section, you will see the number of alarms that are currently open for that layer, the average duration of the open alarms, and the maximum duration for which an alarm had remained open.
-
The menu at the top of this page permits monitor users to view the status of the monitored elements such as Zones, Services, Segments, and individual Components (see Figure 6).
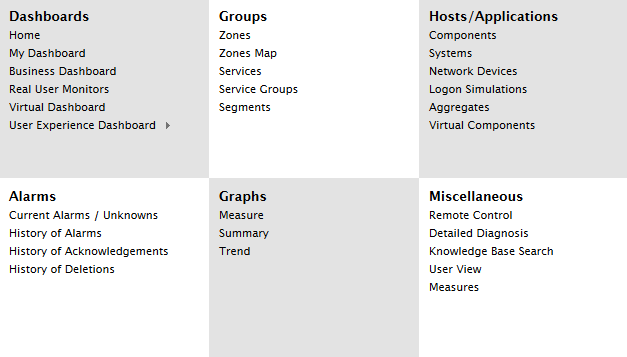
In addition to this, the menu also facilitates the following:
- Switching to the monitor Home page from anywhere in the monitor interface
- Browsing for any measure across the environment and focusing on its current status
- The viewing of the current alarms, and the complete alarm history
- The generation of a wide variety of graphs including, measure, summary, and trend graphs
- The viewing of detailed diagnostic measures and the execution of remote control on agent hosts
Note:
The detailed diagnosis and remote control capabilities will be available only if the license permits them.
To know more about the monitor home page, refer to