The Virtual Dashboard
Large virtualized environments are typically characterized by hundreds of virtual hosts, with tens of VMs configured on each host. In such environments, if a mission-critical application executing on a VM experiences a slowdown, the key challenge for the administrator is to determine what caused the slowdown - is it because the VM is under-sized? is it owing to a resource contention at the virtual host level? Is it because of other resource-hungry VMs? or is it owing to resource-intensive processes spawned by the target application itself? Also, as VM migration would be rampant in such environments, administrators are required to know when, why, and to which virtual host a VM was migrated, and even assess the impact of such a shift on the source and the destination hosts.
eG Enterprise provides dedicated monitoring models for a variety of virtualization platforms to enable administrators to address the performance concerns cited above. By analyzing the resource usage of VMs from inside and outside, and using an intelligent correlation engine to differentiate problem symptoms from sources, these models accurately point to the root-cause of slowdowns experienced by a virtual application. In addition, these models are also capable of tracking the movement of VMs from one host to another and alerting administrators to the same. However, the key limitation of these models is that the aforesaid capabilities are 'hidden' inside the layers, tests, and measures offered by the models. To bring these capabilities to light, administrators would have to invest a considerable amount of time and mouse clicks!
A quicker, 'single glance' alternative to this is the Virtual Dashboard. The Virtual Dashboard provides administrators of virtualized environments the wherewithal to accurately diagnose the cause for slowdowns experienced by a virtual application, with minimal effort and time! This dashboard collates critical resource usage data from the host operating system and from 'inside' and 'outside' all the VMs on a virtual server, presents them in graphical and tabulated formats in a single interface in the eG monitoring console, and thus aids instant and effective performance analysis. In the event of a problem situation therefore, administrators can use the Virtual Dashboard to rapidly find answers to the following questions:
- Is the host experiencing a resource crunch? If so, which resource is being drained - CPU/memory/disk? Which processes executing on the host could be causing the resource bottleneck?
- How are the VMs using the physical resources of the host? Is any VM consuming resources excessively? If so, which VM is it?
- Were sufficient resources allocated to the VMs? How are the VMs using the resources allocated to them?
- Are resource-intensive processes executing on any VM? If so, which VM is being impacted, and what are the rogue processes?
- Did any VM migrate during the last hour (by default)? If so, which VM is it? Which server was it migrated to? How is the VM handling the physical and allocated resources in the destination host?
In addition to current problems, the dashboard also sheds light on the probable causes for issues that occurred in the past, thus paving the way for effective post-mortem analysis.
In virtualized environments where multiple administrators monitor the VMs using different eG managers, some key issues may not be addressed immediately since all the administrators may not be aware of the underlying issues reported by all the eG managers. It is therefore necessary to configure all such eG managers to an eG SuperManager. When all such eG managers are configured, the egsm user of the eG SuperManager has a holistic view of all the VMs that are available for monitoring by the individual eG managers. This helps the egsm user to instantly identify the problematic VMs and the root-cause of the problems.
To view the virtual dashboard,click the Virtual Dashboard from the Dashboards tile of the eG monitor interface.
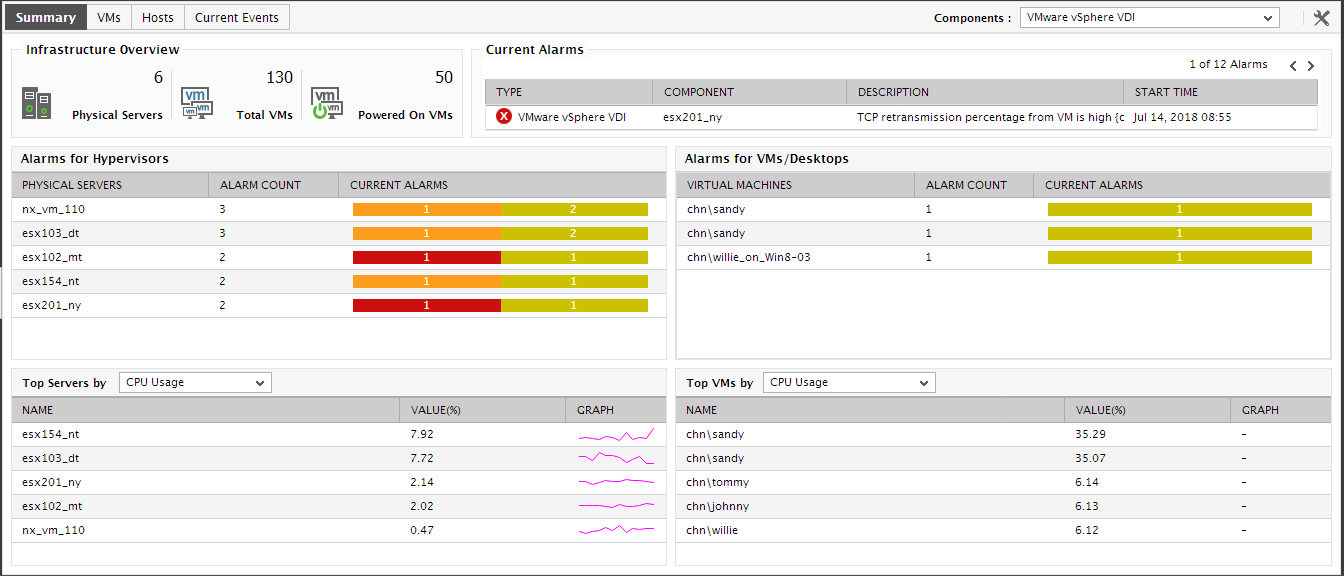
Figure 1 : The Virtual Dashboard
Note:
- The egsm user has "read-only" access to the virtual dashboard.
- A user with administrator privileges can add, read and modify the virtual dashboard.
To know more about the virtual dashboard, refer to