Monitoring Tomcat Servers
Using the specialized monitoring model that eG Enterprise offers for the Tomcat server (see Figure 1), one can extensively monitor every layer of the Tomcat server, automatically correlate performance across the layers, and accurately locate the problem source.
Note:
The eG agent can monitor a Tomcat server, only if the Tomcat server executes on JDK 1.5 or above.
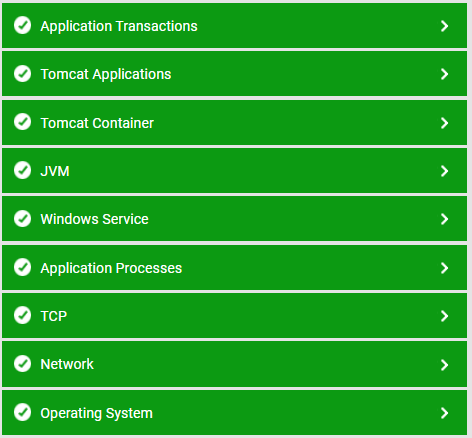
Figure 1 : The layer model of the Tomcat server
Each layer depicted by Figure 1 performs a number of tests on the Tomcat server and evaluates the critical aspects of Tomcat performance such as thread usage, memory management, processing capabilities of the servlets, efficiency of the JSP engine, etc.
The eG agent begins monitoring the Tomcat Server once the pre-requisites discussed in the Pre-requisites for Monitoring the Tomcat Servers are fulfilled. The statistics so collected enable administrators find quick and accurate answers to persistent performance-related queries, such as the following:
| Availability monitoring |
|
| Thread pool usage monitoring |
|
| Servlet monitoring |
|
| Jasper monitoring |
|
| Connector monitoring |
|
| JVM monitoring |
|
| Session manager monitoring |
|
| Cache monitoring |
|