PeopleSoft Tuxedo Log Monitor Test
The TUXLOG files enable administrators to trace the Tuxedo component for troubleshooting information. Using the PeopleSoft Tuxedo Log Monitor Test, administrators can periodically scan these log files for specific patterns of errors/warnings, and can efficiently troubleshoot them.
Target of the test : A Tuxedo Application Server
Agent deploying the test : An internal agent
Outputs of the test : One set of results for every AlertFile and SearchPattern pair configured.
| Parameter | Description |
|---|---|
|
Test Period |
How often should the test be executed. |
|
Host |
The host for which the test is being configured. |
|
Port |
Specify the port at which the specified host listens in the Port text box. By default, this is NULL. |
|
AlertFile |
This test monitors the TUXLOG files for errors/warnings. Typically, these log files will be available in the <PSHome>\appserv\<domain>\LOGS directory and will be named in the following format: TUXLOG.mmddyy, where <mmddyy> refers to the month, date, and year of creation of the log file. In the logs directory therefore, you will find multiple TUXLOG files, one for every day of the month. To enable the test to monitor a specific TUXLOG file, you need to provide the full path to that log file against AlertFile. For instance, if <PSHome> (on Windows) is C:\ps, the name of the PeopleSoft domain is psdomain, and the log file you want to monitor was created on the 3rd of May, 2017, your AlertFile specification will be: C:\ps\appserv\psdomain\LOGS\TUXLOG.050317. Multiple log files can also be monitored as a comma-separated list. For instance, your AlertFile specification can be: C:\ps\appserv\psdomain\LOGS\TUXLOG.050317, C:\ps\appserv\psdomain\LOGS\TUXLOG.052017. Specific log file name patterns can also be specified. For example, to monitor all the log files created in the months of March and April (i.e., in the 3rd and 4th months), the parameter specification can be, : C:\ps\appserv\psdomain\ Your AlertFile specification can also be of the following format: Name@logfilepath_or_pattern. Here, Name represents the display name of the path being configured. For instance, to monitor all TUXLOG log files that were created in the months of March and April, your specification can be: Marchlogs@ C:\ps\appserv\psdomain\LOGS\TUXLOG_03*15, Every time this test is executed, the eG agent verifies the following:
If a few lines have been added to a log file that was monitored previously, then the eG agent monitors the additions to that log file, and then proceeds to monitor newer log files (if any). If an older log file has been overwritten, then, the eG agent monitors this log file completely, and then proceeds to monitor the newer log files (if any). |
|
SearchPattern |
Enter the specific patterns of alerts to be monitored. The pattern should be in the following format: <PatternName>:<Pattern>, where <PatternName> is the pattern name that will be displayed in the monitor interface and <Pattern> is an expression of the form - *expr* or expr or *expr or expr*, etc. A leading '*' signifies any number of leading characters, while a trailing '*' signifies any number of trailing characters. For example, say you specify ORA:ORA-* in the SearchPattern text box. This indicates that "ORA" is the pattern name to be displayed in the monitor interface. "ORA-*" indicates that the test will monitor only those lines in the alert log which start with the term "ORA-". Similarly, if your pattern specification reads: offline:*offline, then it means that the pattern name is offline and that the test will monitor those lines in the alert log which end with the term offline. A single pattern may also be of the form e1+e2, where + signifies an OR condition. That is, the <PatternName> is matched if either e1 is true or e2 is true. Multiple search patterns can be specified as a comma-separated list. For example: ORA:ORA-*,offline:*offline*,online:*online If the AlertFile specification is of the format Name@logfilepath, then the descriptor for this test in the eG monitor interface will be of the format: Name:PatternName. On the other hand, if the AlertFile specification consists only of the log file path, then the descriptors will be of the format: LogFilePath:PatternName. If you want all the messages in a log file to be monitored, then your specification would be: <PatternName>:*. |
|
Lines |
Specify two numbers in the format x:y. This means that when a line in the alert file matches a particular pattern, then x lines before the matched line and y lines after the matched line will be reported in the detail diagnosis output (in addition to the matched line). The default value here is 0:0. Multiple entries can be provided as a comma-separated list. If you give 1:1 as the value for Lines, then this value will be applied to all the patterns specified in the SearchPattern field. If you give 0:0,1:1 as the value for Lines and if the corresponding value in the SearchPattern field is like Error:ERROR:*, Fail:*failed, then: 0:0 will be applied to Error:ERROR:* pattern 1:1 will be applied to Fail:*failedpattern |
|
ExcludePattern |
Provide a comma-separated list of patterns to be excluded from monitoring in the ExcludePattern text box. For example: JOLT_CAT*,LIBTUX_CAT*. By default, this parameter is set to ‘none’. |
|
UniqueMatch |
By default, this parameter is set to False, indicating that, by default, the test checks every line in the log file for the existence of each of the configured SearchPatterns. By setting this parameter to True, you can instruct the test to ignore a line and move to the next as soon as a match for one of the configured patterns is found in that line. For example, assume that Error:*ERROR:*, Fail:*failed* is the SearchPattern that has been configured. If UniqueMatch is set to False, then the test will read every line in the log file completely to check for the existence of messages embedding the strings ‘ERROR:’ and ‘failed’. If both the patterns are detected in the same line, then the number of matches will be incremented by 2. On the other hand, if UniqueMatch is set to True, then the test will read a line only until a match for one of the configured patterns is found and not both. This means that even if the strings ‘ERROR:’ and ‘failed’ follow one another in the same line, the test will consider only the first match and not the next. The match count in this case will therefore be incremented by only 1. |
|
RotatingFile |
This flag governs the display of descriptors for this test in the eG monitoring console. If this flag is set to True, then the descriptors of this test will be displayed in the following format: Directory_containing_monitored_file:<SearchPattern>. For instance, if the AlertFile parameter is set to C:\ps\appserv\psdomain\LOGS\TUXLOG.042015, and RotatingFile is set to True, then, your descriptor will be of the following format: C:\ps\appserv\psdomain\LOGS:<SearchPattern>. On the other hand, if the RotatingFile flag had been set to False, then the descriptors will be of the following format: <FileName>:<SearchPattern> - i.e., TUXLOG.042015:<SearchPattern> in the case of the example above. |
|
CaseSensitive |
This flag is set to No by default. This indicates that the test functions in a ‘case-insensitive’ manner by default. This implies that, by default, the test ignores the case of your AlertFile and SearchPattern specifications. If this flag is set to Yes on the other hand, then the test will function in a ‘case-sensitive’ manner. In this case therefore, for the test to work, even the case of your AlertFile and SearchPattern specifications should match with the actuals. |
|
RolloverFile |
By default, this flag is set to False. Set this flag to True if you want the test to support the ‘roll over’ capability (if any) of the specified AlertFile. A roll over typically occurs when the timestamp of a file changes or when the log file size crosses a pre-determined threshold. When a log file rolls over, the errors/warnings that pre-exist in that file will be automatically copied to a new file, and all errors/warnings that are captured subsequently will be logged in the original/old file.In such a scenario, since the RolloverFile flag is set to False by default, the test by default scans only the original/old file for new log entries and ignores the new file. On the other hand, if the flag is set to True, then the test will scan both old and the rolled-over file for new entries. If you want this test to support the ‘roll over’ capability described above, the following conditions need to be fulfilled:
|
|
OverwrittenFile |
By default, this flag is set to False. Set this flag to True if log files do not ‘roll over’ in your environment, but get overwritten instead. In such environments typically, new messages that are captured will be written into the log file that pre-exists and will replace the original contents of that log file; unlike when ‘roll over’ is enabled, no new log files are created for new entries in this case. If the OverwrittenFile flag is set to True, then the test will scan the new entries in the log file for matching patterns. However, if the flag is set to False, then the test will ignore the new entries. |
|
EncodeFormat |
By default, this is set to none, indicating that no encoding format applies by default. However, if the test has to use a specific encoding format for reading from the specified AlertFile , then you will have to provide a valid encoding format here. Where multiple log files are being monitored, you will have to provide a comma-separated list of encoding formats – one each for every log file monitored - - eg., UTF-8, UTF-16. Make sure that your encoding format specification follows the same sequence as your AlertFile specification. In other words, the first encoding format should apply to the first alert file, and so on. Note: If your AlertFile specification consists of file patterns that include wildcard characters (eg., C:\ps\appserv\psdomain\LOGS\TUXLOG.03*15, C:\ps\appserv\psdomain\LOGS\TUXLOG.04*15), then such configurations will only be supported in the ANSI format, and not the UTF format. |
|
UseUTF8 |
By default, this flag is set to No, implying that the test does not use the UTF-8 format to read from the log files configured for monitoring. However, if the test has to use only the UTF-8 format for reading from all the log files configured for monitoring in your AlertFile specification, then set this flag to Yes. |
|
UseUTF16 |
By default, this flag is set to No, implying that the test does not use the UTF-16 format to read from the log files configured for monitoring. However, if the test has to use only the UTF-16 format for reading from all the log files con figured for monitoring in your AlertFile specification, then set this flag to Yes. Note: If your AlertFile specification consists of file patterns that include wildcard characters (eg.,C:\ps\appserv\psdomain\LOGS\TUXLOG.03*15, C:\ps\appserv\psdomain\LOGS\TUXLOG.04*15), then such configurations will only be supported in the ANSI format, and not the UTF format. |
|
DD Frequency |
Refers to the frequency with which detailed diagnosis measures are to be generated for this test. The default is 1:1. This indicates that, by default, detailed measures will be generated every time this test runs, and also every time the test detects a problem. You can modify this frequency, if you so desire. Also, if you intend to disable the detailed diagnosis capability for this test, you can do so by specifying none against DD Frequency. |
|
Detailed Diagnosis |
To make diagnosis more efficient and accurate, the eG Enterprise embeds an optional detailed diagnostic capability. With this capability, the eG agents can be configured to run detailed, more elaborate tests as and when specific problems are detected. To enable the detailed diagnosis capability of this test for a particular server, choose the On option. To disable the capability, click on the Off option. The option to selectively enable/disable the detailed diagnosis capability will be available only if the following conditions are fulfilled:
|
| Measurement | Description | Measurement Unit | Interpretation |
|---|---|---|---|
|
Number of messages |
Indicates the number of messages matching this SearchPattern found in this AlertFile. |
Number |
Use the detailed diagnosis of this measure to view these error messages completely. |
The detailed diagnosis of the Number of messages measure displays the detailed messages that match the configured SearchPattern.
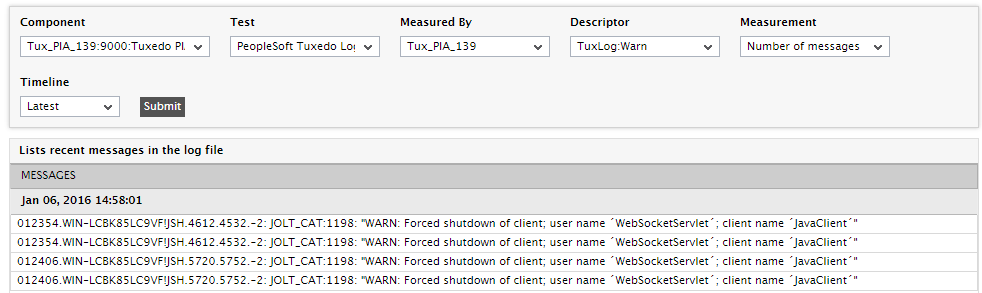
Figure 1 : The detailed diagnosis of the PeopleSoft Tuxedo Log Monitor Test