
Disk Activity Test
When executed on Windows systems, this test reports statistics pertaining to the input/output utilization of each physical disk on a system.
Target of the test : Any host system
Agent deploying the test : An internal agent
Outputs of the test : One set of results for each physical disk on the host monitored.
| Parameter | Description |
|---|---|
|
Test Period |
How often should the test be executed. |
|
Host |
The host for which the test is to be configured. |
|
Useexe |
Setting the USEEXE flag to true, ensures that the disk activity metrics are collected by executing a binary instead of dynamically linking to the Performance instrumentation library. By default, this is set to false |
|
Use Sudo |
By default, the USE SUDO parameter is set to No. This indicates that, by default, this test will report metrics by executing the df -Pk –l command on the Solaris host. However, in some highly secure environments, the eG agent install user may not have the permissions to execute this command directly. In such cases, do the following:
|
|
Disks |
The Disks parameter lets you to choose the type of disks that you want to monitor. By default, Physical will be selected from the Disks list box indicating that this test will monitor the physical disks in the target host. However, you can override this setting as per your requirement. If you want to monitor the logical disks on the target host, choose Logical from the Disks list box. Likewise, selecting All from the list box will help you to monitor both physical and logical disks on the target host. |
|
High Security |
This flag is applicable only when the target Linux host is monitored in the agentless manner. In highly secure environments, eG Enterprise could not perform agentless monitoring on a Linux host using SSH. To enable monitoring of the Linux hosts in such environments, set the HIGH SECURITY flag to Yes. It indicates that eG Enterprise will connect to the target Linux host in a more secure way and collect performance metrics. By default, this flag is set to No. |
|
Trace |
By default, this flag is set to No, indicating that the test does not generate in-depth details such as details on read/write activities on each file stored in the disk, by default. In such a way, you can conserve storage space on the eG database. However, if you want the test to generate and store details of read/write activities performed on each and every file in the disk, set the Trace flag to Yes |
|
Disk Busy Percent |
This parameter is applicable only when the Trace flag is set to Yes. Specify the percentage of time beyond which the test should reveal the detailed diagnosis for the Disk Busy measure. By default, this parameter is set to 20. However, you can override this value as per your requirement. |
|
Read Size in KB |
This parameter is applicable only when the Trace flag is set to Yes and the Disk Busy measure violates the value specified against the “Disk Busy Percent” parameter. By default, the value of this parameter is set to 10 KB. This indicates that the detailed diagnosis of this test will include the details of only those files from which data of size greater than or equal to 10 KB has been read. This setting will help you to conserve space on the database and also to identify the files on which maximum read operations were performed. However, you can override the default value of this parameter as per your requirement. |
|
Write Size in KB |
This parameter is applicable only when the Trace flag is set to Yes and the Disk Busy measure violates the value specified against the “Disk Busy Percent” parameter. By default, the value of this parameter is set to 10 KB. This indicates that the detailed diagnosis of this test will include the details of only those files on which data of size greater than or equal to 10 KB has been written. This setting will help you to conserve space on the database and also to identify the files on which more number of write operations were performed. However, you can override the default value of this parameter as per your requirement. |
|
Disk Response Time Secs |
This parameter is applicable only when the Trace flag is set to Yes and the Disk Busy measure violates the value specified against the “Disk Busy Percent” parameter. By default, the value of this parameter is set to 1 second. This indicates that the detailed diagnosis of this test will include the details of only those files that took longer than 1 second to read/write data of size specified against the Read Size in KB and Write Size in KB parameters. This setting will help you to conserve space on the database and also to identify the files that took longer time to respond to read/write requests. However, you can override the default value of this parameter as per your requirement. |
|
Event Capture Interval In Secs |
This parameter is applicable only when the Trace flag is set to Yes and the Disk Busy measure violates the value specified against the “Disk Busy Percent” parameter. By default, the value of this parameter is set to 10 seconds. This setting ensures that the test will only capture the details of the disk events performed during the last 10 seconds of the specified measurement period. In addition, the detailed diagnosis of this test will include the details of the files involved in the disk events captured during the interval specified against this parameter only if the size of the data read from/written to the files is greater than or equal to the values specified against the Read Size in KB and Write Size in KB parameters or the response time of the read/write operations is greater than or equal to the values specified against the Disk Response Time Secs parameter. However, you can override the default value of this parameter as per your requirement. |
|
Ignore Non Local |
By default, this flag is set to No indicating that this test will monitor the operations performed on the local drives as well as on the remotely accessed or network-based drives. However, if you want this test to monitor only the local disk activities performed within the system's direct storage (e.g., internal SSDs or HDDs), then set this flag to Yes. |
|
IOTOP Location |
By default, the IOTOP LOCATION parameter is set to none. This indicates that the eG agent would automatically discover the default location of the iotop package i.e. /usr/bin or /usr/sbin, for executing the sudo command when the USE SUDO flag is set to yes. However, if the iotop package is installed in a different location in your environment, then specify that location in the IOTOP LOCATION text box. |
|
Display Mounts |
By default, this parameter is set to false. This indicates that this test will report the I/O utilization of the disk drives by default. However, if you wish set this flag to true, then the eG agent will map the disk drives to mount points and reports the I/O utilization of each mount point in the target Linux server. To this effect, the mount points discovered by this test will be the descriptors. |
|
High Security |
This flag is applicable only when the target Linux host is monitored in the agentless manner. In highly secure environments, eG Enterprise could not perform agentless monitoring on a Linux host using SSH. To enable monitoring of the Linux hosts in such environments, set the HIGH SECURITY flag to Yes. It indicates that eG Enterprise will connect to the target Linux host in a more secure way and collect performance metrics. By default, this flag is set to No. |
|
DD Frequency |
Refers to the frequency with which detailed diagnosis measures are to be generated for this test. The default is 1:1. This indicates that, by default, detailed measures will be generated every time this test runs, and also every time the test detects a problem. You can modify this frequency, if you so desire. Also, if you intend to disable the detailed diagnosis capability for this test, you can do so by specifying none against DD frequency. |
|
Detailed Diagnosis |
To make diagnosis more efficient and accurate, the eG Enterprise embeds an optional detailed diagnostic capability. With this capability, the eG agents can be configured to run detailed, more elaborate tests as and when specific problems are detected. To enable the detailed diagnosis capability of this test for a particular server, choose the On option. To disable the capability, click on the Off option. The option to selectively enable/disable the detailed diagnosis capability will be available only if the following conditions are fulfilled:
|
| Measurement | Description | Measurement Unit | Interpretation |
|---|---|---|---|
|
Disk busy: |
Indicates the percentage of elapsed time during which the disk is busy processing requests (i.e., reads or writes). |
Percent |
Comparing the percentage of time that the different disks are busy, an administrator can determine whether the application load is properly balanced across the different disks. The detailed diagnosis of this measure will reveal the top-10 I/O-intensive processes executing on the host. |
|
Disk busy due to reads: |
Indicates the percentage of elapsed time that the selected disk drive is busy servicing read requests. |
Percent |
|
|
Disk busy due to writes: |
Indicates the percentage of elapsed time that the selected disk drive is busy servicing write requests. |
Percent |
|
|
Disk read time: |
Indicates the average time in seconds of a read of data from the disk. |
Secs |
|
|
Disk write time: |
Indicates the average time in seconds of a write of data from the disk. |
Secs |
|
|
Avg queue length: |
Indicates the average number of both read and write requests that were queued for the selected disk during the sample interval. |
Number |
|
|
Current disk queue length: |
The number of requests outstanding on the disk at the time the performance data is collected. |
Number |
This measure includes requests in service at the time of the snapshot. This is an instantaneous length, not an average over the time interval. Multi-spindle disk devices can have multiple requests active at one time, but other concurrent requests are awaiting service. This counter might reflect a transitory high or low queue length, but if there is a sustained load on the disk drive, it is likely that this will be consistently high. Requests experience delays proportional to the length of this queue minus the number of spindles on the disks. This difference should average less than two for good performance. |
|
Disk read rate: |
Indicates the number of reads happening on a logical disk per second. |
Reads/Sec |
A dramatic increase in this value may be indicative of an I/O bottleneck on the server. |
|
Data read rate from disk: |
Indicates the rate at which bytes are transferred from the disk during read operations. |
KB/Sec |
A very high value indicates an I/O bottleneck on the server. |
|
Disk write rate: |
Indicates the number of writes happening on a local disk per second. |
Writes/Sec |
A dramatic increase in this value may be indicative of an I/O bottleneck on the server. |
|
Data write rate to disk: |
Indicates the rate at which bytes are transferred from the disk during write operations. |
KB/Sec |
A very high value indicates an I/O bottleneck on the server. |
|
Disk service time: |
Indicates the average time that this disk took to service each transfer request ( i.e., the average I/O operation time) |
Secs |
A sudden rise in the value of this measure can be attributed to a large amount of information being input or output. A consistent increase however, could indicate an I/O processing bottleneck. |
|
Disk queue time: |
Indicates the average time that transfer requests waited idly on queue for this disk. |
Secs |
Ideally, the value of this measure should be low. |
|
Disk I/O time: |
Indicates the avarage time taken for read and write operations of this disk. |
Secs |
The value of this measure is the sum of the values of the Disk service time and Disk queue time measures. A consistent increase in the value of this measure could indicate a latency in I/O processing. |
|
Avg IO read size: |
Indicates the average number of bytes transferred from disk during read operations. |
KB |
Larger I/Os tend to have higher latency (for example, BACKUP/RESTORE operations issue 1 MB transfers by default). |
|
Avg IO write size: |
Indicates the average number of bytes transferred into disk during write operations. |
KB |
|
|
Split IO: |
Reports the rate at which the operating system divides I/O requests to the disk into multiple requests. |
Splits/Sec |
A split I/O request might occur if the program requests data in a size that is too large to fit into a single request or if the disk is fragmented. Factors that influence the size of an I/O request can include application design, the file system, or drivers. A high rate of split I/O might not, in itself, represent a problem. However, on single-disk systems, a high rate for this counter tends to indicate disk fragmentation. |
The detailed diagnosis of the Disk busy measure and the Avg queue length measure reveal the top-10 I/O-intensive processes executing on the target host.
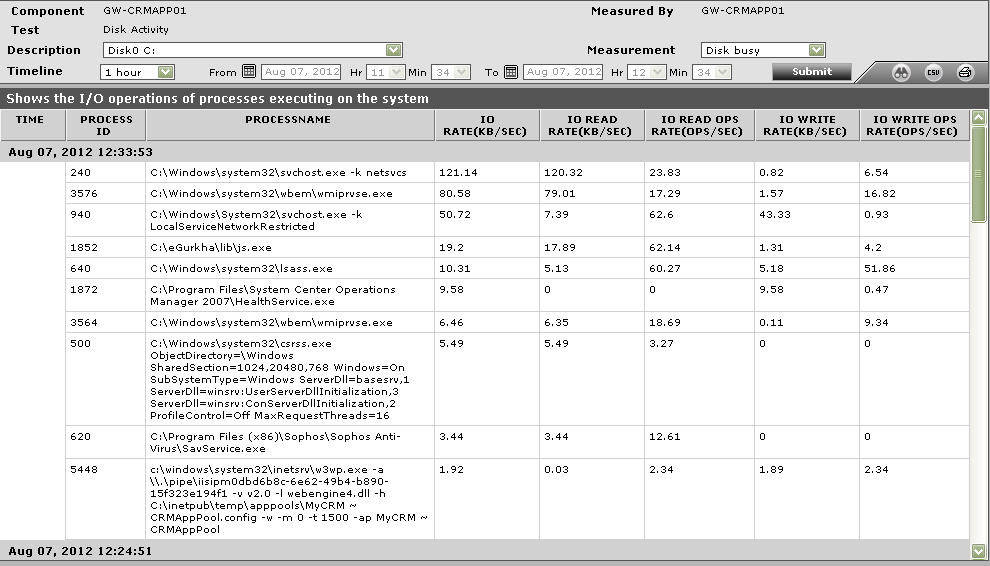
Figure 1 : The detailed diagnosis of the Disk Activity test
