Failover Cluster Services/Applications Test
A variety of different services or applications can be configured for high availability in a failover cluster. While some services/applications are cluster-aware – i.e., are applications that function in a co-ordinated way with other cluster components – some others are cluster-unaware – i.e., are applications that do not interact with the cluster at all.
The list of cluster-aware applications that administrators can choose from when configuring high-availability are as follows:
-
DFS Namespace Server: Provides a virtual view of shared folders in an organization. When a user views the namespace, the folders appear to reside on a single hard disk. Users can navigate the namespace without needing to know the server names or shared folders that are hosting the data.
-
DHCP Server: Automatically provides client computers and other TCP/IP-based network devices with valid IP addresses.
-
Distributed Transaction Coordinator (DTC): Supports distributed applications that perform transactions. A transaction is a set of related tasks, such as updates to databases, that either succeed or fail as a unit.
-
File Server: Provides a central location on your network where you can store and share files with users.
-
Internet Storage Name Service (iSNS) Server: Provides a directory of iSCSI targets.
-
Message Queuing: Enables distributed applications that are running at different times to communicate across heterogeneous networks and with computers that may be offline.
-
Other Server: Provides a client access point and storage only.
-
Print Server: Manages a queue of print jobs for a shared printer.
-
Remote Desktop Connection Broker (formerly TS Session Broker): Supports session load balancing and session reconnection in a load-balanced remote desktop server farm. RD Connection Broker is also used to provide users access to RemoteApp programs and virtual desktops through RemoteApp and Desktop Connection.
-
Virtual Machine: Runs on a physical computer as a virtualized computer system. Multiple virtual machines can run on one computer.
-
WINS Server: Enables users to access resources by a NetBIOS name instead of requiring them to use IP addresses that are difficult to recognize and remember.
To configure high-availability for services/applications that are cluster-unaware, administrators can use the Generic Application, Generic Script, and Generic Service options.
When configuring fail-over for a service/application, you need to assign an IP address to that service/application. You can also add storage to a clustered service/application, or even associate additional resources with the service/application.
When a service/application fails over, administrators may need to know which cluster node that service/application has switched to. Likewise, administrators will also need to know if fail-over was unsuccessful for a service/application, and if so, why - is it because the cluster disk used by the service/application has run out of space? Is it because the IP address of the service/application is in conflict with another IP address in the environment? Is it because the service/application has been deliberately stopped or brought to the offline mode? The Failover Cluster Service/Applications Test provides administrators with answers to all these questions!
For each service/application that has been configured for high-availability, this test reports the current state of that service/application, thus enabling administrators to figure out if fail-over was successful or not. The test additionally reports the IP state and server state of each service/application and tracks the space usage in the storage mapped to a service/application, thus pointing administrators to the probable cause for service failures. The resources added to every service/application and the current state of the resources is also revealed, so that administrators can determine whether/not the offline state of a resource is causing the dependent service/application to fail.
Target of the test : A node in a Windows cluster
Agent deploying the test : An internal agent
Outputs of the test : One set of results for each service/application managed by every cluster created
| Parameter | Description |
|---|---|
|
Test Period |
How often should the test be executed |
|
Host |
The host for which the test is to be configured. |
|
DD frequency |
Refers to the frequency with which detailed diagnosis measures are to be generated for this test. The default is 1:1. This indicates that, by default, detailed measures will be generated every time this test runs, and also every time the test detects a problem. You can modify this frequency, if you so desire. Also, if you intend to disable the detailed diagnosis capability for this test, you can do so by specifying none against DD Frequency. |
|
Detailed Diagnosis |
To make diagnosis more efficient and accurate, the eG Enterprise embeds an optional detailed diagnostic capability. With this capability, the eG agents can be configured to run detailed, more elaborate tests as and when specific problems are detected. To enable the detailed diagnosis capability of this test for a particular server, choose the On option. To disable the capability, click on the Off option. The option to selectively enable/disable the detailed diagnosis capability will be available only if the following conditions are fulfilled:
|
|
Measurement |
Description |
Measurement Unit |
Interpretation |
||||||||||||||||||||
|---|---|---|---|---|---|---|---|---|---|---|---|---|---|---|---|---|---|---|---|---|---|---|---|
|
Service/application status |
Indicates the current state of this service/application. |
Number |
The values that this measure can report and the states they indicate have been listed in the table below:
Note: By default, this measure can report the Measure Values mentioned above while indicating the current state of the service/application. However, the graph of this measure is indicated using the numeric equivalents. If this measure reports the value 90 for a service/application, it is a clear indicator that that service/application could not be failed over. In such a situation, you can check the value of the Server state, IP state, Failed resources, and Percentage of space free in used cluster disks measures of that service to know what could have possibly caused the service/application to fail. For further diagnosis, you can also use the detailed diagnostics reported by this test, which reveals the resources associated with the service/application and the current state of each resource. |
||||||||||||||||||||
|
Server status |
Indicates the current state of the server created in the cluster for this service/application.
|
Number |
When using the Failover Cluster Manager to configure high availability for a service/application, you are required to provide a fully qualified DNS name for the service/application being configured and assign an IP address to it. This measure reports the current state of that DNS name. To know which name was assigned to the service, use the detailed diagnosis of this measure. The values that this measure can report and the states they indicate have been listed in the table below:
Note: By default, this measure can report the Measure Values mentioned above while indicating the current state of the server. However, the graph of this measure is indicated using the numeric equivalents. |
||||||||||||||||||||
|
IP status |
Indicates the current status of the IP address assigned to this service/application. |
Number |
The values that this measure can report and the states they indicate have been listed in the table below:
Note: By default, this measure can report the Measure Values mentioned above while indicating the current state of the IP address. However, the graph of this measure is indicated using the numeric equivalents. Use the detailed diagnosis of this measure to know the IP address assigned to the service/application. |
||||||||||||||||||||
|
Has the owner changed? |
Indicates whether/not the owner of this service/application has changed since the last measurement period. |
|
The values that this measure can report and their corresponding numeric values have been listed in the table below:
If this measure reports the value No for a service/application, and Service state is Failed, then it clearly indicates that fail-over has not occurred for that service/application. Note: By default, this measure reports one of the Measure Values listed in the table above. The graph of this measure however will represent whether/not the owner has changed using the numeric equivalents only. To know which node currently owns the service/application, use the detailed diagnosis of this measure. |
||||||||||||||||||||
|
Total disk space |
Indicates the total capacity of all cluster disks mapped to this service/application. |
MB |
Use the detailed diagnosis of this measure to know which cluster disks are attached to a service/application, the current status of the disks, and the usage of each disk. |
||||||||||||||||||||
|
Total free space |
Indicates the total amount of free space in all cluster disks mapped to this service/application. |
MB |
Ideally, the value of this measure should be high. |
||||||||||||||||||||
|
Percentage of space free |
Indicates the percentage of space that is free in the cluster disks mapped to this service/application. |
MB |
Ideally, the value of this measure should be high. Compare the value of this measure across services/applications to know which service/application has the least free space. You may want to make space in the cluster disks mapped to this service/application, so as to prevent service/application failure owing to lack of space. |
||||||||||||||||||||
|
Total resources |
Indicates the number of other resources that are online in this service/application. |
Number |
Use the detailed diagnosis of this measure to know the name, type, and owner of all the resources associated with a service/application. |
||||||||||||||||||||
|
Online resources |
Indicates the number of resources associated with this service/application that are currently online. |
Number |
Use the detailed diagnosis of this measure to know the name, type, state and owner of the online resources associated with a service/application. |
||||||||||||||||||||
|
Offline resources |
Indicates the number of resources associated with this service/application that are currently offline. |
Number |
Use the detailed diagnosis of this measure to know the name, type, state, and owner of the offline resources associated with a service/application. |
||||||||||||||||||||
|
Failed resources: |
Indicates the number of resources associated with this service/application that have failed currently. |
Number |
Ideally, the value of this measure should be 0. If this measure reports a non-zero value, you can use the detailed diagnosis of this measure to know the name, type, state, and owner of each of the failed resources associated with a service/application. |
The detailed diagnosis of the Service/application status measure reveals the name and state of the resources associated with a service.

Figure 1 : The detailed diagnosis of the Service/application status measure
The detailed diagnosis of the Server status measure reveals the DNS name that was assigned to the service/application when it was configured for high availability.

Figure 2 : The detailed diagnosis of the Server status measure
Using the detailed diagnosis of the IP status measure you can determine the IP address assigned to the service/application.

Figure 3 : The detailed diagnosis of the IP status measure
To know which node currently owns the service/application, use the detailed diagnosis of the Has the owner changed? measure.

Figure 4 : The detailed diagnosis of the Has the owner changed? measure
Use the detailed diagnosis of the Total disk space measure to know which cluster disks are attached to a service/application, the current status of the disks, and the usage of each disk. With the help of this information, administrators can quickly identify those disks that may be running out of space and draw out plans to increase the capacity of such disks, so that service/application failures can be averted.
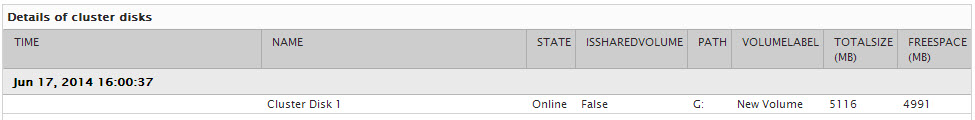
Figure 5 : The detailed diagnosis of the Total disk space measure
The detailed diagnosis of the Failed resources measure reveals the name, type, current state, owner, and resource group of each failed resource.
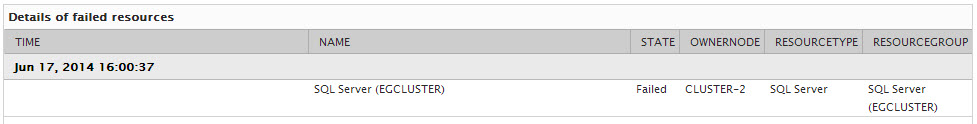
Figure 6 : The detailed diagnosis of the Failed resources measure
The detailed diagnosis of the Offline resources measure reveals the name, type, current state, owner, and resource group of each failed resource.
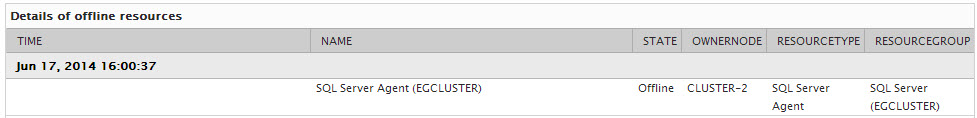
Figure 7 : The detailed diagnosis of the Offline resources measure