Handles Usage Test
This test monitors and tracks the handles opened by processes running in a target Windows system.
Target of the test : A Windows host
Agent deploying the test : An internal agent
Outputs of the test : One set of results for the Windows host being monitored
| Parameter | Description |
|---|---|
|
Test Period |
How often should the test be executed. |
|
Host |
The host for which the test is to be configured. |
|
Handle growth limit |
This defines the upper limit of the handles opened by any process. By default, this parameter is set to 100000. |
|
Ignore processes in DD |
The detailed diagnosis of the Processes using handles above limit measure reveals the top-10 processes that are using handles above the configured limit, the number of handles used by each process, and the break-up of the handle count by sub-handles (i.e., the count of file handles, disk handles, etc.). For processes that typically open thousands of handles, storing granular, sub-handle-level information pertaining to these handles may impose additional strain on the eG database. In such cases, you can reduce the strain on the eG database by configuring in the Ignore processes in DD text box, a comma-separated list of process names/process patterns for which sub-handle-wise breakup need not be collected and stored in the eG database. The default value in this text box is *ccSvcHst.exe*. This implies that, by default, the detailed diagnosis of the Processes using handles above limit measure will only provide the total number of open handles for ccSvcHst.exe process, but not the sub-handle-level information. If required, you can choose to exclude the sub-handle-wise breakup from the detailed diagnosis for more processes by including these process names/patterns as part of the Ignore processes in DD specification. For instance, your specification can be: *ccSvcHst.exe*,*js.exe*,*java.exe*: |
|
Show sub handles in DD |
By default, this flag is set to No indicating that this test will not report sub-handle details as part of its detailed diagnostics, by default. This setting will help you to conserve space in the eG database. However, you can set this flag to Yes if you want to see the sub-handles opened by each of the top-10 processes in the detailed diagnosis. To this effect, a Top 10 Open Handles column will be populated with relevant information in the detailed diagnostics reported for the Processes using handles above limit measure. |
|
Exclude Processes In DD |
Specify a comma-separated list of processes that should be excluded from the scope of reporting as part of the detailed diagnostics of the Processes using handles above limit measure. For instance, your specification can be: *ccSvcHst.exe*,*js.exe*,*java.exe* |
|
Detailed Diagnosis |
To make diagnosis more efficient and accurate, the eG Enterprise embeds an optional detailed diagnostic capability. With this capability, the eG agents can be configured to run detailed, more elaborate tests as and when specific problems are detected. To enable the detailed diagnosis capability of this test for a particular server, choose the On option. To disable the capability, click on the Off option. The option to selectively enable/disable the detailed diagnosis capability will be available only if the following conditions are fulfilled:
|
| Measurement | Description | Measurement Unit | Interpretation |
|---|---|---|---|
|
Handles used by processes: |
Indicates the number of handles opened by various processes running in a target Windows system in the last measurement period. |
Number |
Use the detailed diagnosis of this measure to determine the top-10 processes in terms of number of handles opened. This information brings to light those processes with too many open handles. By closely tracking the handle usage of these processes over time, you can identify potential handle leaks. |
|
Processes using handles above limit: |
Indicates the number of processes that have opened the handles on or above the value defined in the input parameter - HANDLES GROWTH LIMIT. |
Number |
Using the detailed diagnosis of this measure, you can accurately isolate the process(es) that has opened more handles than the permitted limit. A high value of this measure indicates that too many processes are opening handles excessively. You might want to closely observe the handle usage of these processes over time to figure out whether the spike in usage is sporadic or consistent. A consistent increase in handle usage could indicate a handle leak. |
The detailed diagnosis of the Handles used by processes measure, if enabled, lists the names of top-10 processes in terms of handle usage, the number of handles each process uses, the process ID, and the ID of the parent process.
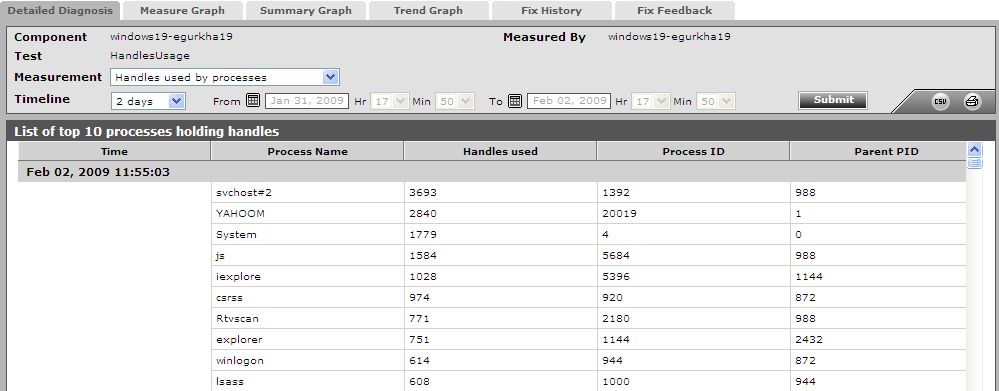
Figure 1 : The detailed diagnosis of the Handles used by processes measure
The detailed diagnosis of the Processes using handles above limit measure, if enabled, lists the details of processes that are using more handles than the configured limit.
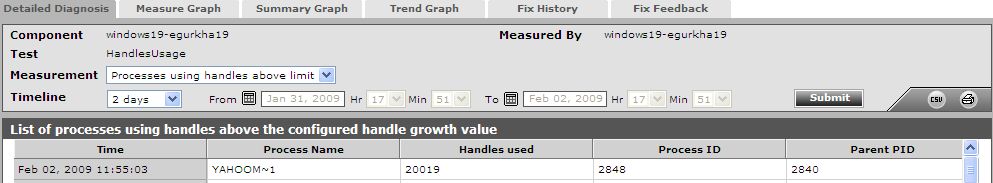
Figure 2 : The detailed diagnosis of the Processes using handles above limit measure