Process State Test
This test reports the total number of processes running on a system and the number of processes in the different process states - active, sleeping, runnable, zombie, stopped, etc. An unusually large number of processes in any of these six states can be an indicator of a problem.
This test is disabled by default. To enable the test, go to the enable / disable tests page using the menu sequence : Agents -> Tests -> Enable/Disable, pick the desired Component type, set Performance as the Test type, choose the test from the DISABLED TESTS list, and click on the << button to move the test to the ENABLED TESTS list. Finally, click the Update button.
Target of the test : A Solaris, Linux, or HPUX system only
Agent deploying the test : An internal agent
Outputs of the test : One set of results for every server being monitored
| Parameter | Description |
|---|---|
|
Test Period |
How often should the test be executed. |
|
Host |
The host for which the test is to be configured. |
|
Detailed Diagnosis |
To make diagnosis more efficient and accurate, the eG Enterprise embeds an optional detailed diagnostic capability. With this capability, the eG agents can be configured to run detailed, more elaborate tests as and when specific problems are detected. To enable the detailed diagnosis capability of this test for a particular server, choose the On option. To disable the capability, click on the Off option. The option to selectively enable/disable the detailed diagnosis capability will be available only if the following conditions are fulfilled:
|
| Measurement | Description | Measurement Unit | Interpretation |
|---|---|---|---|
|
Total processes: |
Indicates the total number of processes on the system. |
Number |
|
|
Running processes: |
Indicates the number of processes that are currently running on a processor. |
Number |
|
|
Sleeping processes: |
Indicates the number of processes that are waiting for an |
Number |
|
|
Runnable processes: |
Indicates the number of processes that are waiting to be scheduled for execution. |
Number |
|
|
Zombie processes: |
Indicates the number of processes that are in the zombie state - i.e., the process terminated, but its parent did not wait for it. |
Number |
|
|
Stopped processes: |
Indicates the number of processes in a stopped state; A process can be in a stopped state if it receives a job control signal. Alternatively, a process that is being traced can also enter this state. |
Number |
|
The detailed diagnosis of the Running processes measure, if enabled, provides the Ids of the processes that are currently running, the user who initiated the processes, and the command used for invoking the process (see Figure 1).
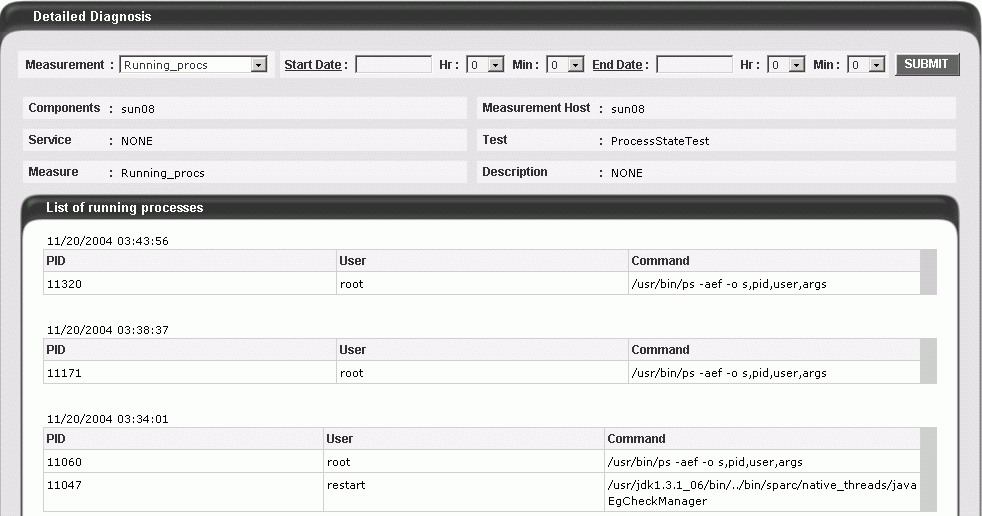
Figure 1 : Detailed diagnosis of the Running processes measure
The detailed diagnosis of the Runnable processes measure, if enabled, provides the Ids of the processes that are waiting to be scheduled for execution, the user who initiated the processes, and the command used for invoking the process (see Figure 2).
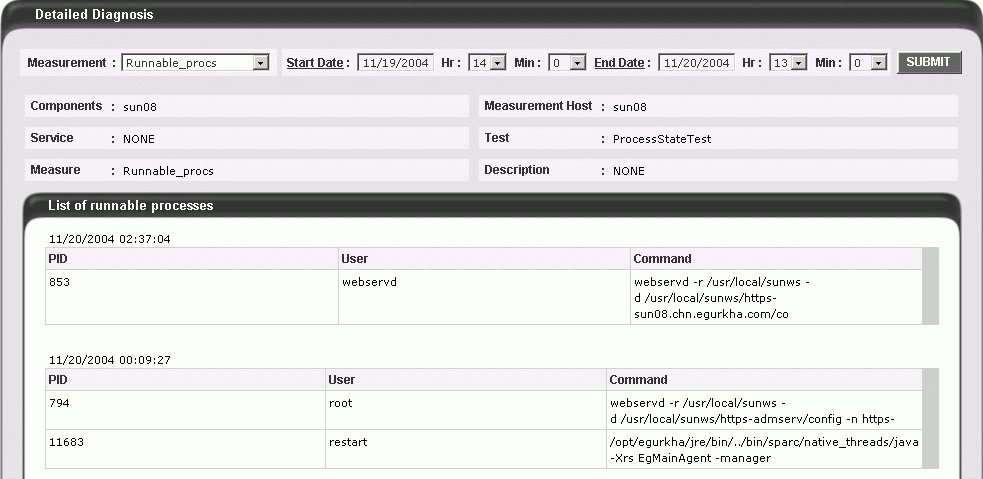
Figure 2 : The detailed diagnosis of the Runnable processes measure
The detailed diagnosis of the Zombie processes measure, if enabled, provides the Ids of the processes that are in a zombie state, the user who initiated the processes, and the command used for invoking the process (see Figure 3).
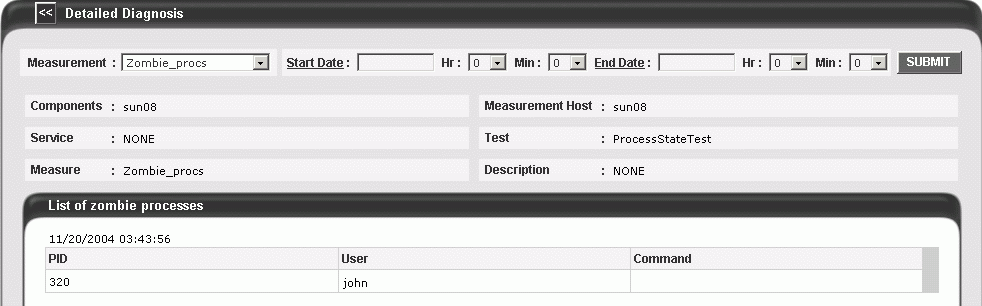
Figure 3 : The detailed diagnosis of the Zombie processes measure
The detailed diagnosis of the Stopped processes measure, if enabled, provides the Ids of the processes that are in a stopped state, the user who initiated the processes, and the command used for invoking the process (see Figure 4).
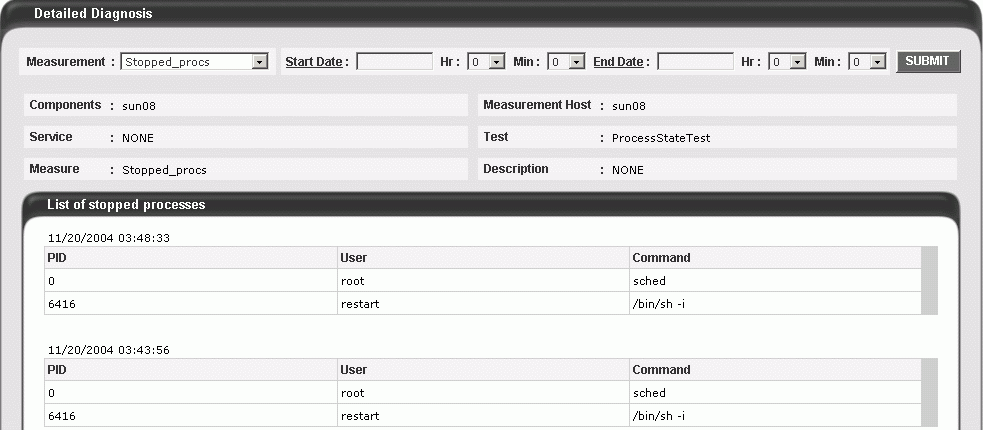
Figure 4 : The detailed diagnosis of the Stopped processes measure