Windows Team Network Traffic Test
NIC teaming, also known as Load Balancing/Failover (LBFO), allows multiple network adapters to be placed into a team for the purposes of:
-
bandwidth aggregation, and/or
-
traffic failover to maintain connectivity in the event of a network component failure.
The architecture of the Windows NIC teaming solution is as follows:
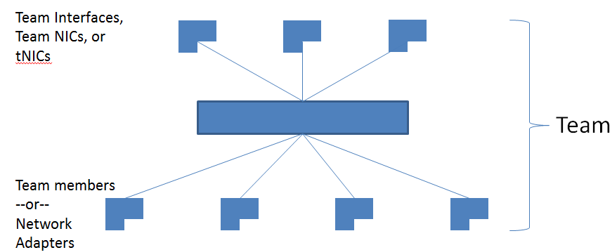
Figure 1 : NIC teaming architecture
One or more physical NICs are connected into the NIC teaming solution common core, which then presents one or more virtual adapters (team NICs [tNICs] or team interfaces) to the operating system. There are a variety of algorithms that distribute outbound traffic between the NICs.
Regardless of the algorithm used, if a single member of a team goes down, then the other active members of that team may end up handling more traffic than their configuration allows. This can increase packet drops and significantly degrade network performance. Administrators should therefore be promptly alerted if even a single member of a team becomes unavailable.
In addition, administrators should closely monitor the bandwidth usage of a team, so that the adequacy of the collective bandwidth resources of the team members can be evaluated, and team capacity expanded if required.
The Windows Team Network Traffic test helps administrators achieve all of the above. This test monitors the status (up/down) of each NIC team, and alerts administrators if even a single member of a team is unavailable. Additionally, the test reports the bandwidth usage of each team and points to those teams that are experiencing a bandwidth contention. The network throughput of each team and packet discards are reported, so that administrators can quickly identify the team with a poor throughput. In the process, the test throws a spotlight on capacity constraints and performance deficiencies in teams, so that administrators can effectively plan the future capacity of their teams and initiate measures to improve network throughput and performance.
This test is disabled by default. To enable the test, go to the enable / disable tests page using the menu sequence : Agents -> Tests -> Enable/Disable, pick the desired Component type, set Performance as the Test type, choose the test from the disabled tests list, and click on the < button to move the test to the ENABLED TESTS list. Finally, click the Update button.
Note:
This test will be applicable only for the Windows hosts 2012 and above.
Target of the test : A Windows host
Agent executing the test : An internal agent
Output of the test : One set of results for each NIC team.
| Parameter | Description |
|---|---|
|
Test Period |
How often should the test be executed. |
|
Host |
The host for which the test is to be configured. |
|
Is Full Duplex |
By default, this flag is set to Yes, indicating that the incoming and outgoing data traffic is handled in full duplex mode. This means that the network interfaces are sending and receiving data at the same time. If the data traffic in your environment is handled in half-duplex mode, set this flag to No. This means that the network interfaces are not sending and receiving data at the same time; in essence, it is a one-way conversation. In this case, the test halves the value of the Incoming traffic and Outgoing traffic measures. |
|
Detailed Diagnosis |
To make diagnosis more efficient and accurate, the eG Enterprise embeds an optional detailed diagnostic capability. With this capability, the eG agents can be configured to run detailed, more elaborate tests as and when specific problems are detected. To enable the detailed diagnosis capability of this test for a particular server, choose the On option. To disable the capability, click on the Off option. The option to selectively enable/disable the detailed diagnosis capability will be available only if the following conditions are fulfilled:
|
| Measurement | Description | Measurement Unit | Interpretation | ||||||
|---|---|---|---|---|---|---|---|---|---|
|
Status |
Indicates the current status of this team. |
|
This measure reports the value Up, if all members of a team are up and running. The value Down is reported if even one member of a team is down. The numeric values that correspond to the measure values mentioned above are as follows:
Note: This test typically reports the Measure Values listed in the table above to indicate the status of a team. In the graph of this measure however, status is represented using the numeric equivalents only. |
||||||
|
Incoming traffic |
Indicates the rate at which data (including framing characters) was received by this team. |
Mbps |
|
||||||
|
Outgoing traffic |
Indicates the rate at which data (including framing characters) was sent by this team. |
Mbps |
|
||||||
|
Total traffic |
Indicates the rate at which (including framing characters) data was handled by this team. |
Mbps |
This is a good indicator of the throughput of a team. |
||||||
|
Max bandwidth |
Represents an estimate of the capacity of the team. |
Mbps |
|
||||||
|
Bandwidth usage |
Indicates the percentage of Max bandwidth used by this team. |
Percent |
A value close to 100% is a cause for concern, as it indicates that the team is about to exhaust the available bandwidth resources. You may want to consider add more NICs to the team to expand its capacity. |
||||||
|
Output queue length |
Indicates the length of the output packet queue for this team. |
Number |
A long output queue could indicate that the team members are unable to transmit packets as quickly as they are being sent to it, causing many outgoing packets to queue up for transmission. This in turn could be owing to inadequate processing power / bandwidth with the team. Consider increasing bandwidth by adding more NICs or try fine-tuning the load-balancing algorithm. |
||||||
|
Outbound packet discards |
Indicates the number of outbound packets that were discarded by this team. |
Number |
|
||||||
|
Outbound packet errors |
The number of outbound packets that could not be transmitted by this team because of errors |
Number |
Ideally, number of outbound errors should be 0. |
||||||
|
Inbound packet discards |
The number of inbound packets that were discarded by this team. |
Number |
|
||||||
|
Inbound packet errors |
The number of inbound packets that contained errors preventing them from being deliverable to a higher-layer protocol. |
Number |
Ideally, number of inbound errors should be 0. |
||||||
|
Packets received |
Indicates the rate at which the packets were received by this team. |
KB/sec |
|
||||||
|
Packets sent |
Indicates the rate at which the packets were sent by this team. |
KB/sec |
|