The Measures Dashboard
Clicking on a VM in the Server View or a virtual desktop in the Desktop View will lead you to the Measures dashboard, which provides deep-dive insights into the performance of that VM/virtual desktop. These insights are offered via the following tab pages - VM Operating System, Network/TCP, Logon, User Experience/Activity, and Others. Of the aforesaid tab pages, the Logon, User Experience/Activity, and Others tab pages are available only for a virtual desktop and not a VM. Using these tab pages, you can evaluate the performance of the operating system of the VM/virtual desktop, analyze network usage, observe TCP connections and user logons, and measure user experience, in real-time, and capture abnormalities (if any).
The sections below discuss each of these tab pages.
The VM Operating System Tab Page
The tests and measures displayed in this tab page reveal the health of the operating system on which the chosen VM runs.
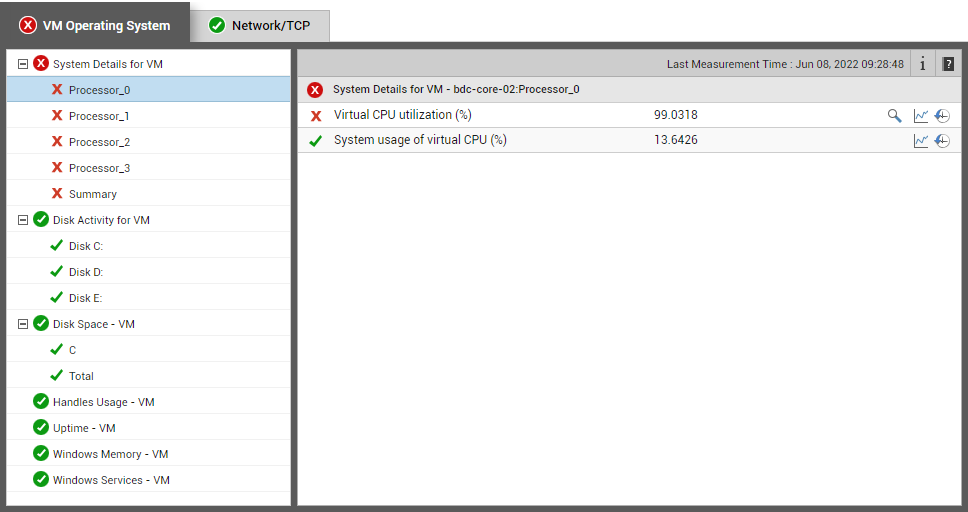
Figure 1 : The VM Operating System tab page
The Network/TCP Tab Page
Using the tests displayed under this hood, you can swoop down on TCP connection drops, high rate of TCP retransmissions, network connectivity issues, and network traffic congestions experienced by the chosen VM.
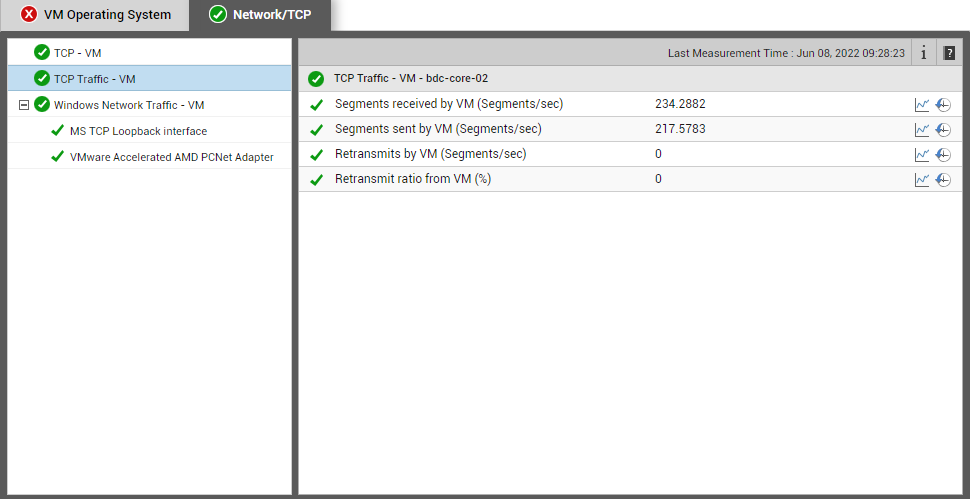
Figure 2 : The Network/TCP tab page
The Logon Tab Page
You can track user logons to a virtual desktop and measure the logon performance of each user at the desktop-end using this tab page. Note that this tab page is available only for VDI environments.
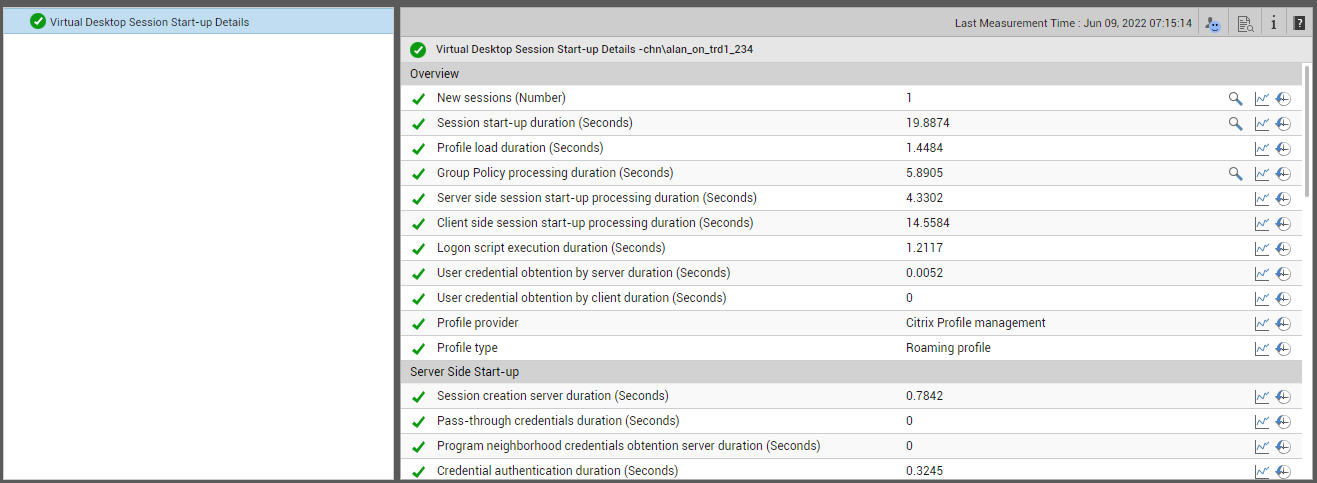
Figure 3 : The metrics displayed in the Logon tab page
The User Experience/Activity Tab Page
The tests mapped to this tab page help track user activities on and measure user experience with the chosen virtual desktop. Note that this tab page is available only for VDI environments.
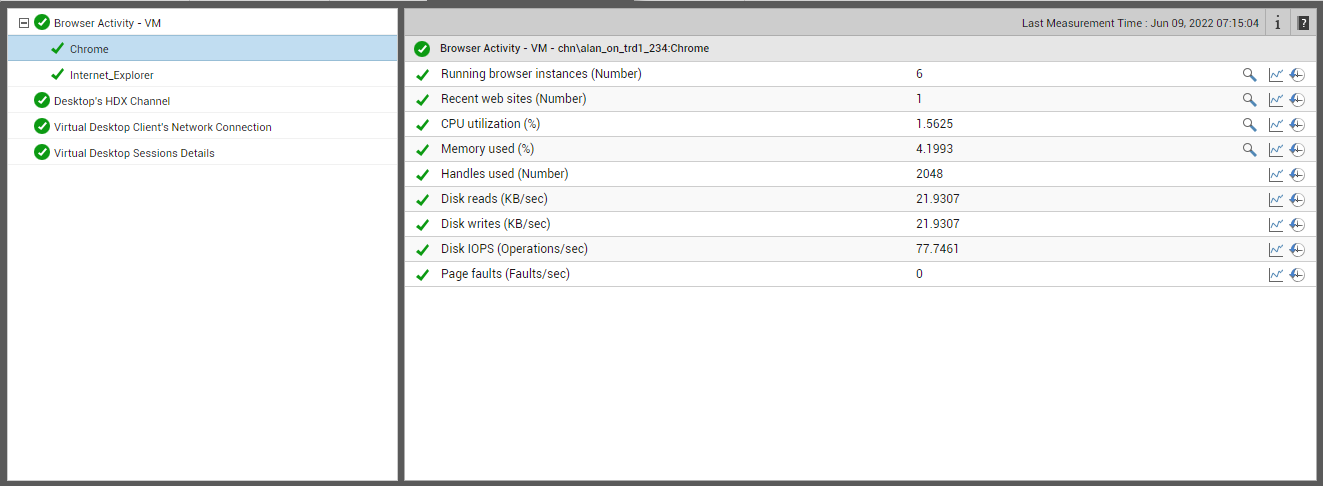
Figure 4 : The metrics displayed in the User Experience/Activity tab page
The Others Tab Page
This tab page reports user input delays, so that poor responsiveness of applications can be promptly captured. Note that this tab page is available only for VDI environments.
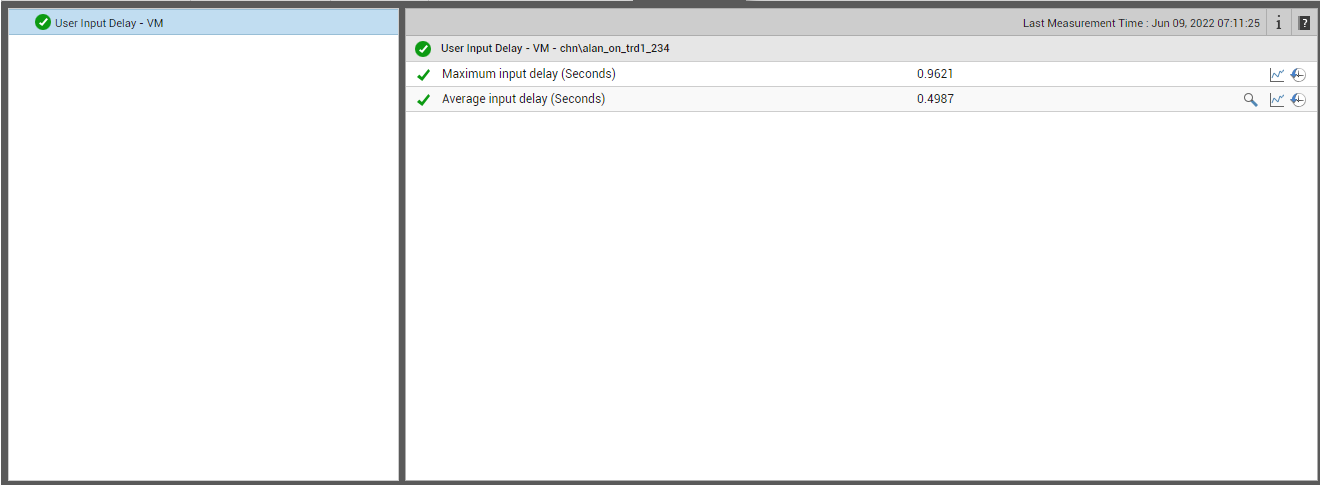
Figure 5 : The metrics displayed in the Others tab page