The Resource Pools Tab Page
If resource pools have been configured on a virtual host, then the eG agent auto-discovers these pools and displays them as sub-nodes of a virtual host-node. The Resource Pools tab page appears only when a resource pool in the tree is clicked on (see Figure 1). This tab page reveals the current configuration of the chosen resource pool, which includes the number of virtual machines on the resource pool, the number of running virtual machines, and the number of child resource pools. Besides the configuration, administrators can also use this tab page to determine the current state of each of the virtual machines and child resource pools under the chosen resource pool, and simultaneously analyze the resource usage by the pool.
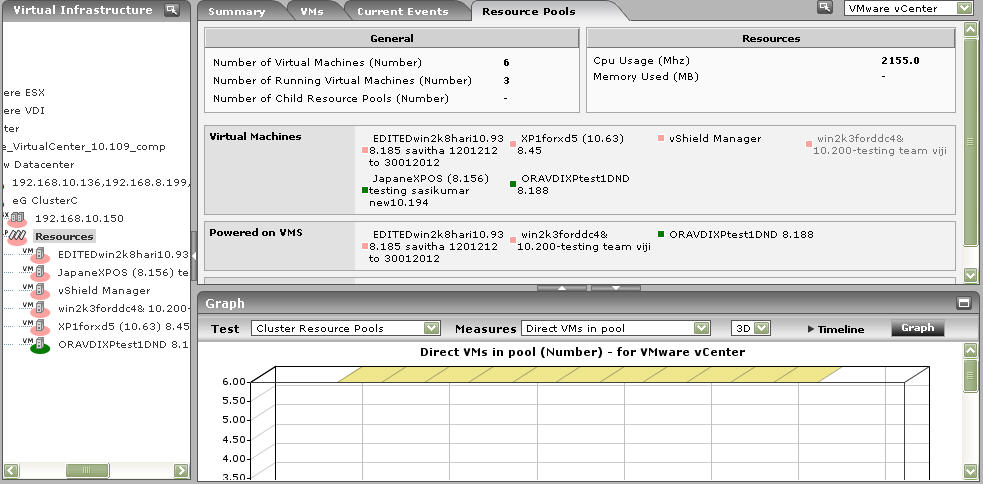
Figure 1 : The Resource Pools tab page
Clicking on a VM listed against the Virtual Machines section of a resource pool leads administrator directly to the layer model page of the virtual host on which that resource pool is configured, and automatically displays metrics that provide an “outside view” of that VM’s performance (see Figure 2). These metrics help administrators in understanding the impact the VM has on the physical resources of the virtual host.
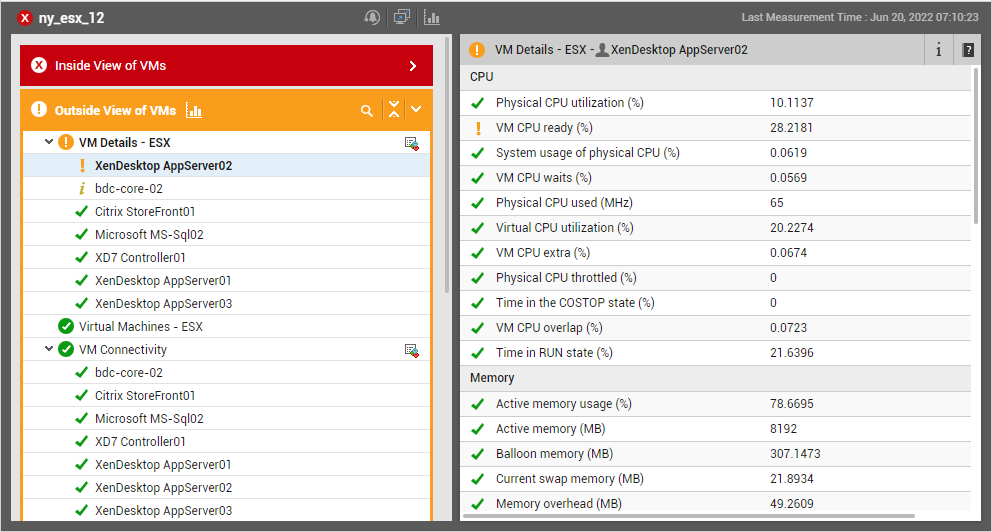
Figure 2 : The outside view of a VM under the resource pool
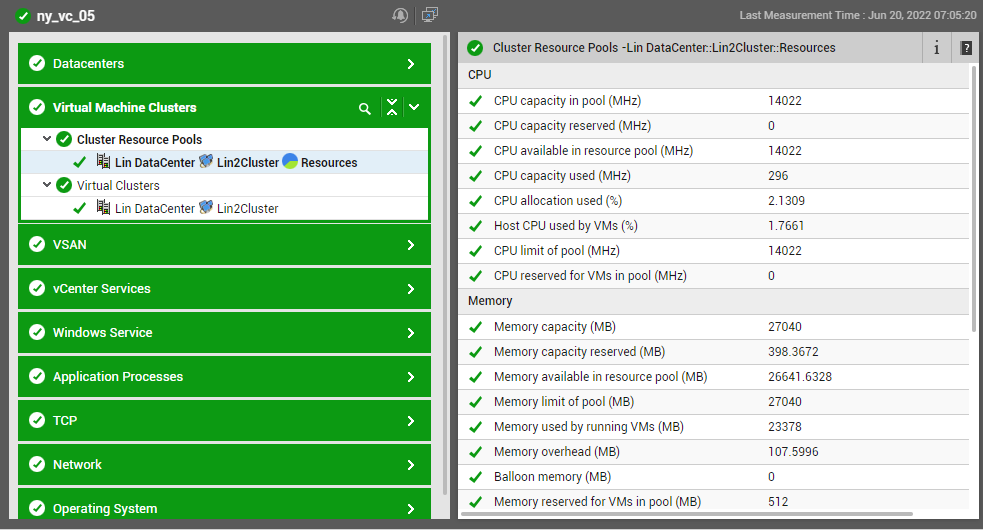
Similarly, clicking on a particular child resource pool displayed against the Child Resource Pools section of Figure 1, takes the administrator to the layer model page of the corresponding virtual host, thereby granting him a sneak peek at the resource usage metrics of that child resource pool, and enabling him to analyze how resource-intensive the child is (see Figure 3).