The Summary Tab Page
The Summary tab page serves as a single, central interface that combines ‘problem and performance information’ related to virtual infrastructures. Using this tab page, administrators can perform the following with ease:
- Oversee, by a mere glance, the composition of and the all-round performance of the virtual infrastructure as a whole or of the virtual infrastructure component chosen from the tree;
- View a consolidated list of current alarms pertaining to the node chosen from the tree, and instantly identify problem-prone virtual infrastructure elements;
- Receive real-time updates of the resource usage of physical servers and virtual machines, and instantly identify the hosts/guests experiencing a resource contention;
- Easily analyze and accurately detect disconcerting trends in the resource usage of the physical servers and virtual machines.
This section discusses elaborately discusses the contents and usage of this tab page.
-
As soon as you open the Virtual Dashboard, the Summary tab page in the right panel will, by default, provide a quick overview of the composition and performance of the monitored VMware vSphere ESX servers spread across all the managed zones in the environment . To view the performance summary of a different virtualization platform, select a different option from the Components drop-down at the top of the Summary tab page. By default, VMware vSphere ESX is chosen from this list.
Note:
If required, you can override the default selection in the Components drop-down, so that the Summary tab page provides a macro view of the performance of a virtualization platform of a different type by default. For this, do the following:
- Click on the
 button at the right, top corner of the Summary tab page.
 Figure 1 then appears.
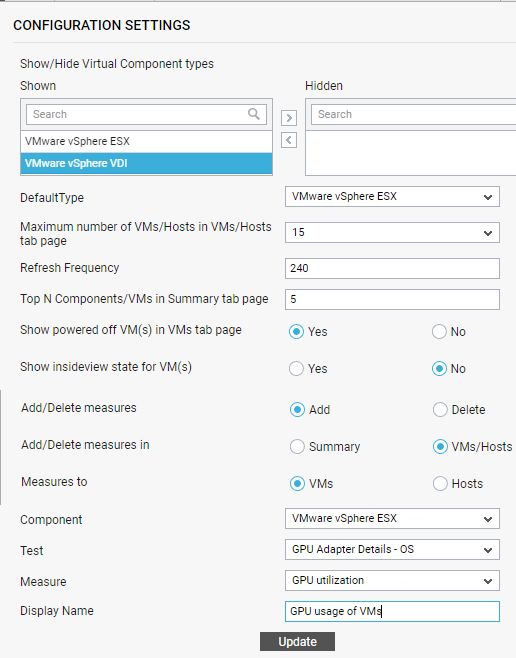
Figure 1 : Overriding the default measures displayed in the VMs tab page
- You will find that the DefaultType list is set to VMware vSphere ESX in Figure 1. This indicates that, by default, the Summary tab page provides an overview of the performance of VMware vSphere servers alone. To view details pertaining to the another virtualized component-type by default, select a different option from the DefaultType list.
- Finally, click the Update button in Figure 1.
- Click on the
-
If you click on a particular zone in the Zones panel or on the node representing the Default zone therein, the Summary tab page will change to provide aggregated performance insights into all VMware vSphere servers (by default), which are part of the chosen zone (see Figure 2).
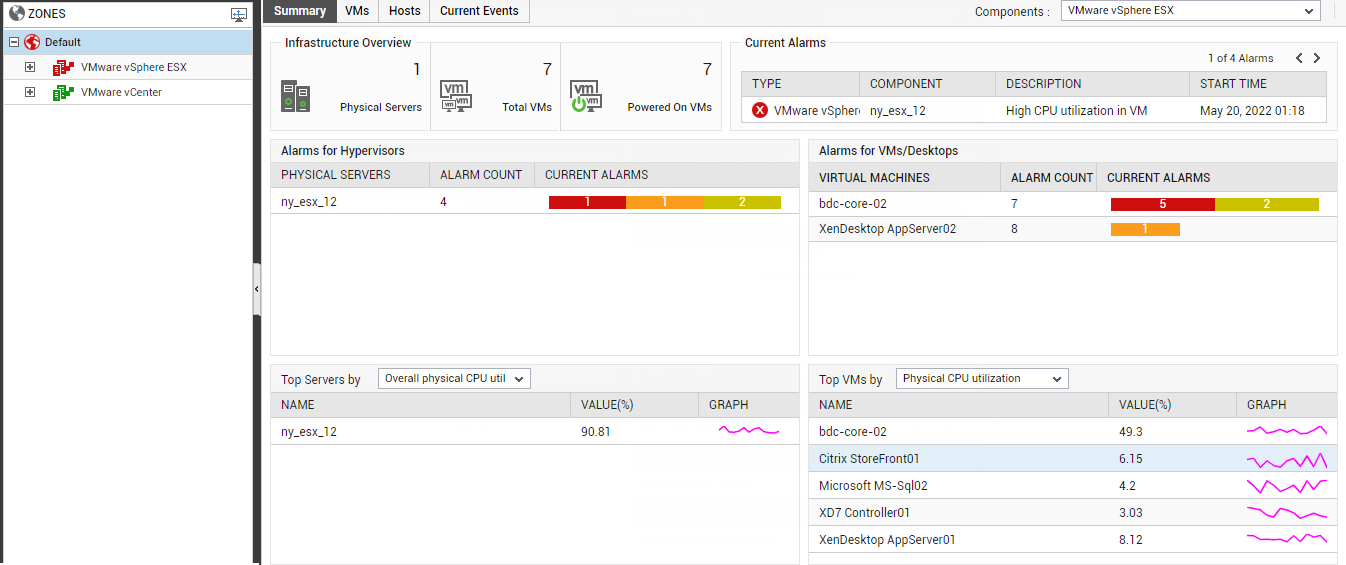
Figure 2 : The Summary tab page if the Default zone node or any specific zone node is clicked
-
For the default VMware vSphere ESX infrastructure, this tab page provides an Infrastructure Overview section that briefly discusses the key ingredients of the virtual infrastructure - i.e., the number of managed physical servers in the target virtual environment, the total number of VMs on the physical servers, the number of VMs that are currently powered on, and the number of alarms currently open on the infrastructure elements. For more details about the target environment, simply move your mouse pointer over every value displayed in the Infrastructure Overview section. For instance, to know the names of physical servers that are being managed in the environment, simply move the mouse pointer over the value corresponding to Physical Servers in the Infrastructure Overview section. The Summary tab page will then change to display a pop-up that lists the names of the physical VMware vSphere ESX servers managed in the environment (see Figure 3). This way, you can view the names of virtual machines executing on the physical servers, the names of powered on VMs, and also the list of current alarms pertaining to the environment. Besides helping you identify VMs that are powered-off currently, the Infrastructure Overview also enables you determine the number and nature of the unresolved problems in the environment.
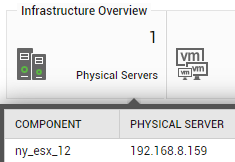
Figure 3 : The names of physical vSphere/ESXi servers displayed in a pop-up
-
Now that you know the names of the physical servers, you might want to analyze the current resource usage of each of these servers to ascertain whether they are experiencing any resource shortages or not. For that, click on the Physical Servers label in the Infrastructure Overview section of Figure 3. This leads you straight to the Hosts tab page, which displays the physical servers managed across all zones configured in the environment, the current state of each server, and also the resource usage metrics pertaining to each server (see Figure 4).
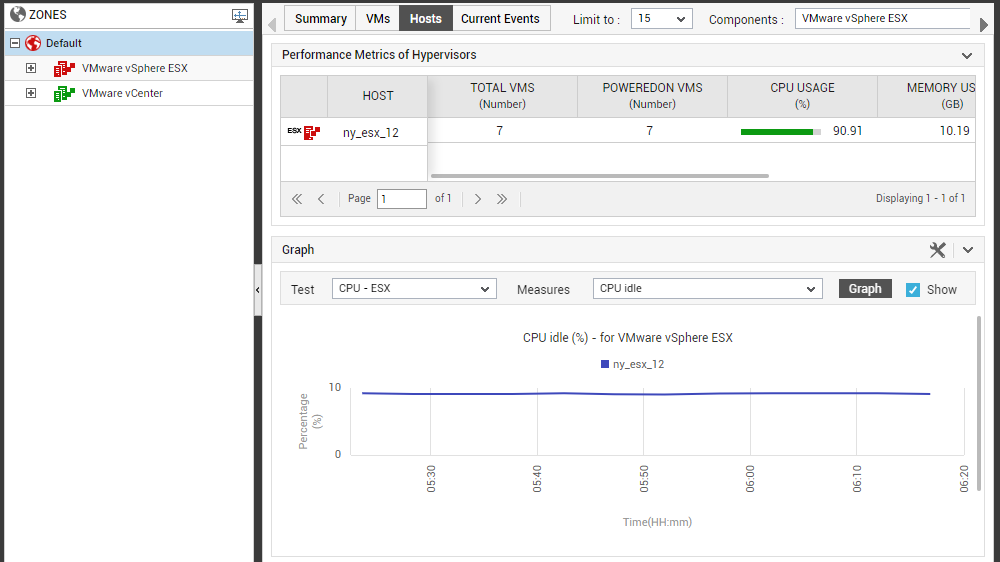
Figure 4 : The Hosts tab page appears when the ‘Physical servers’ label in the Summary tab page is clicked
-
Similarly, you can click on the Total VMs label in the Infrastructure Overview section of Figure 3 to switch to the VMs tab page, focus on the performance of the individual VMs running on all the VMware vSphere ESX servers (by default) managed across the environment, and identify the VM that could be consuming resources excessively (see Figure 5).
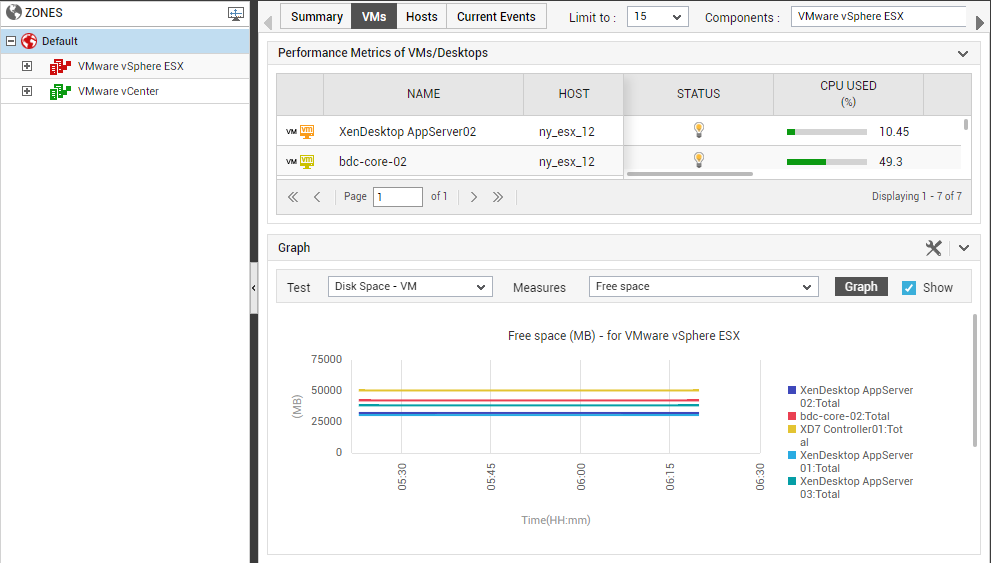
Figure 5 : The VMs tab page that appears when the ‘Total VMs’ label in the Infrastructure View section is clicked
-
Similarly, clicking on the Powered On VMs label in the Infrastructure Overview section takes you to the vms tab page and allows you to analyze the resource usage of powered-on VMs alone (see Figure 6).
-
If you want to focus on each problem closely, then, you can use the Current Alarms section adjacent to the Infrastructure Overview section in the Summary tab page. Use the arrow buttons (<< and >>) above an alarm to navigate to the next alarm. Click on an alarm to view what the problem is and when it occurred, more clearly (seeFigure 7).

Figure 7 : The problem description and start time clearly displayed upon zooming into an alarm in Current Alarms section
-
The Alarms for Hypervisorssection below the Infrastructure Overview section enables you to determine how problem-prone the physical servers in your environment are, by revealing the number of critical, major, and minor issues that are currently unresolved for each physical server. By clicking on an alarm priority corresponding to a physical server, you can view the details of current alarms of that priority (see Figure 8).

Figure 8 : Viewing the details of alarms for hypervisors pertaining to a specific priority
-
The Alarms for VMs/Desktops section enables you to determine how problem-prone the virtual machines in your environment are, by revealing the number of critical, major, and minor issues that currently remain unresolved for each virtual machine. By clicking on an alarm priority corresponding to a virtual machine, you can view the details of current alarms of that priority (see Figure 9).
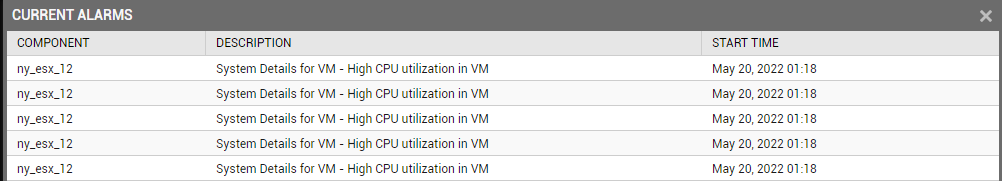
Figure 9 : The list of alarms of the priority that is clicked on in the Alarms for VMs/Desktops section
-
To know which physical server in the chosen zone is resource-hungry, pick a resource usage metric from the Top Servers by drop-down. The top resource consumers in that zone will then be listed. Clicking on a physical server in that list will lead you to Figure 10, where you can receive real-time insights into that resource's usage.
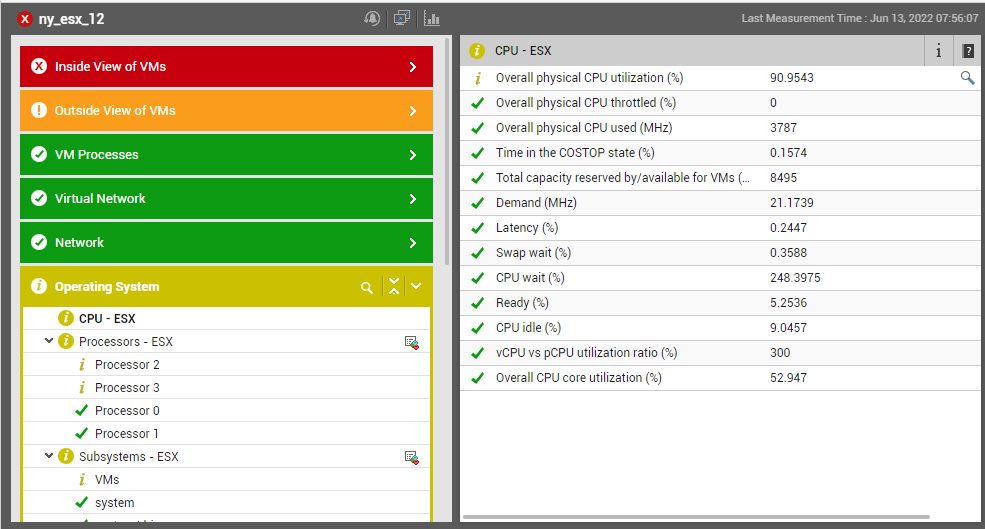
Figure 10 : The layer model of the resource-hungry physical server chosen from the Top Servers by section
-
For historical insights into the usage of a particular resource on a specific physical server, you can use the miniature graph corresponding to that server in the Top Servers by list. Clicking on the graph will magnify it, so you can clearly study the variations in resource usage during the last hour (by default). In the enlarged mode, you can change the graph Timeline for analysis over a broader/shorter time span (see Figure 11). In the event of abnormal resource consumption by a server, you can use the graph to understand whether the usage suddenly spiked or consistently.
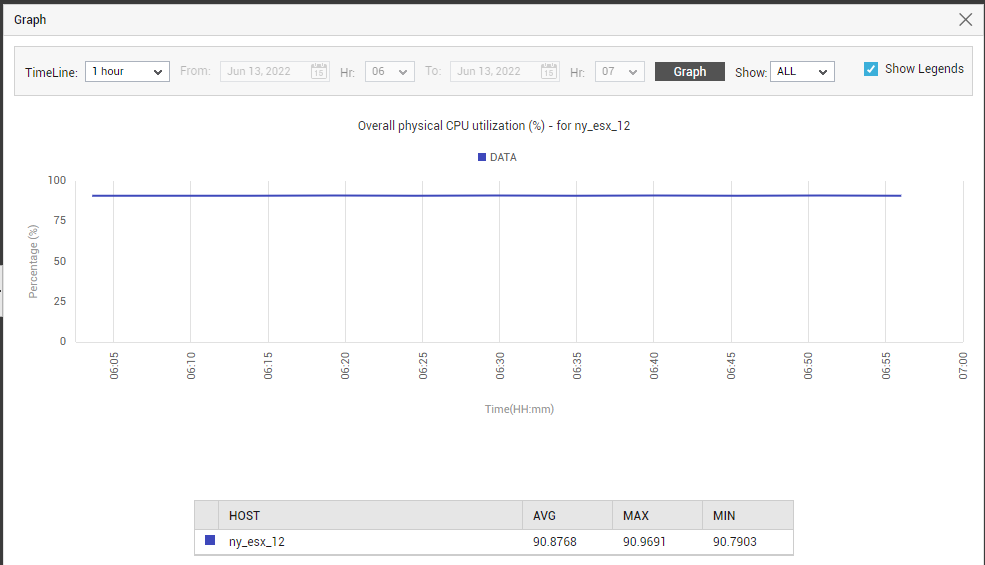
Figure 11 : Physical server resource usage graph in enlarged mode
-
To know which VM is draining the physical server resources, select a resource usage metric from the Top VMs by drop-down. The resulting list will reveal the VMs in the chosen zone that are draining resources. Clicking on a VM will lead you to Figure 12, which reports in real-time how that VM is utilizing the physical resources of the server. For historical insight into the resource usage of a VM, use the miniature graph corresponding to it. Click on the miniature to magnify it. In the enlarged mode, you can change the graph Timeline. The historical analytics help you figure out whether resource usage suddenly spiked or consistently (see Figure 13).

Figure 12 : The Outside View of VMs layer reporting the physical resource usage of the VM clicked on in the Top VMs section
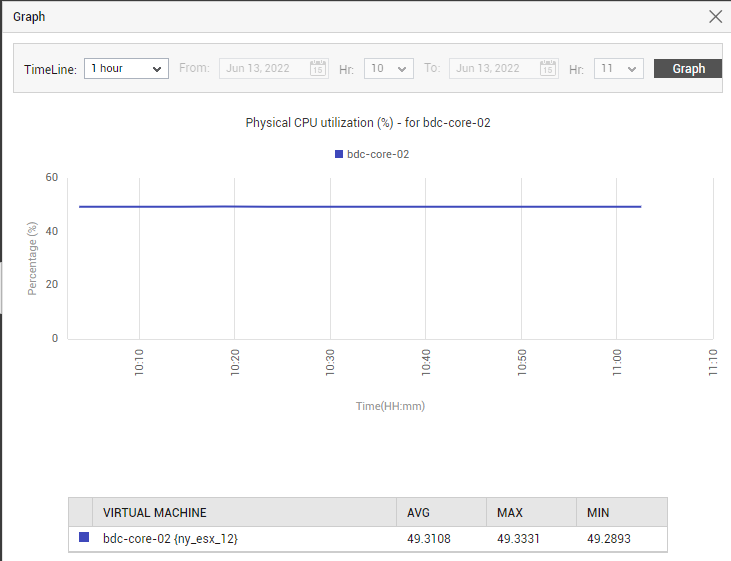
Figure 13 : A graph depicting the relative resource usage of a VM
-
The Top Servers by and Top VMs by drop-down lists are typically populated by a default set of resource usage metrics. You can override this default list using the following procedure:
-
Click on the
button at the right, top corner of the Summary tab page.
-
Figure 14 then appears.
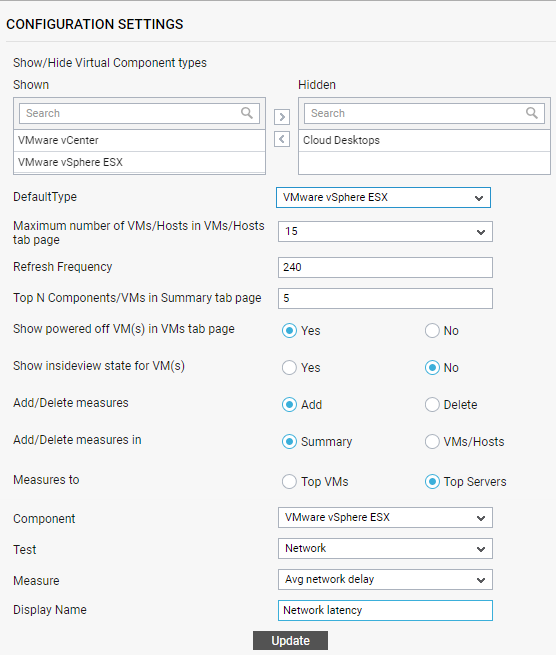
Figure 14 : Overriding the default measure list in the Summary tab page
-
First, select the Add option from the Add/Delete measuressection. To add a new measure to the Summary tab page, select the Summary option from the Add/Delete measures in section in Figure 1.
-
To add measures to the Top Servers by drop-down, select the Top Servers option from the Measures to section of Figure 14. To add measures to the Top VMs by drop-down, select the Top VMs option from the Measures to section.
-
Then, pick the virtualized Component type for which a measure is to be added to the Summary tab page.
-
Select the Test that reports the measure.
-
Choose the Measure.
-
Provide a Display Name for the measure.
-
Finally, click the Update button in Figure 1 to save the changes.
-
To remove an existing measure from the Summary tab page, select the Delete option from Add/Delete measures, pick the Summary option from the Add/Delete measures in section, set the Measures to flag to either Top Servers or Top VMs (as the case may be), select the Component type, pick the Test that reports the measure, pick the Measure, and click the Update button.
-
-
If you click on the node representing a specific vSphere server under a zone in the tree-structure, the Summary tab page will change as depicted by Figure 15. Besides displaying the number of VMs, powered-on VMs, and datastores for the chosen vSphere server, this tab page all displays real-time values and historical graphs for a default set of resource usage metrics collected from that server. A single glance at this tab page will tell you if any VM on the server is powered off, and will also point you to current/potential resource contentions on the server.
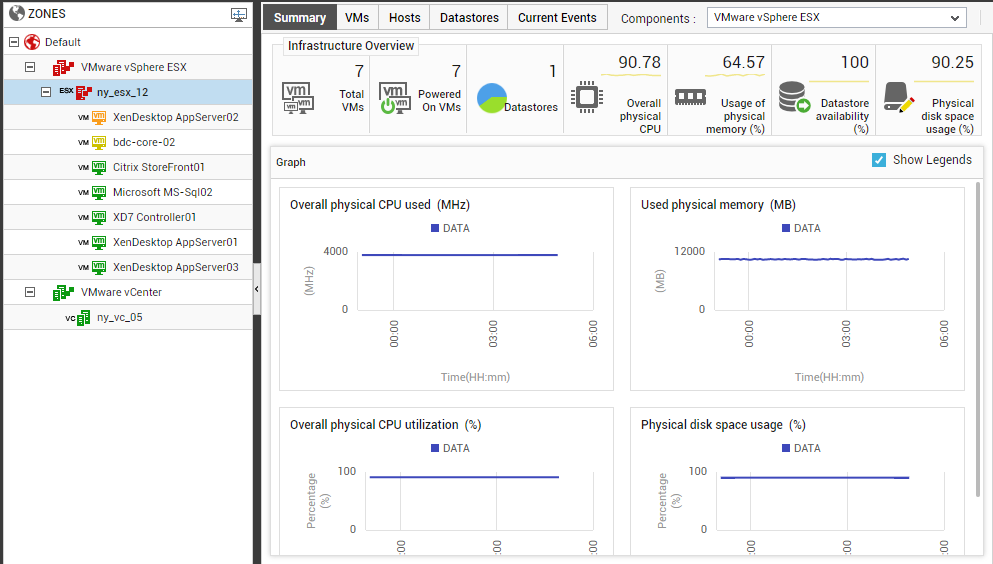
Figure 15 : The Summary tab page when a specific vSphere server is chosen from the tree-structure
-
To know which VMs are provisioned on the chosen server and which of these VMs are powered-on presently, move your mouse pointer over the Total VMs display and then the Powered-on VMs display. By comparing the resultant list of VMs (see Figure 16 and Figure 17), you can quickly identify the powered-off VMs.

Figure 16 : List of VMs on the chosen vSphere server
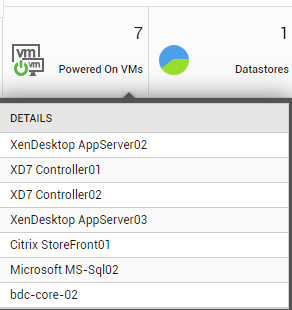
Figure 17 : List of Powered-on VMs on the chosen vSphere server
-
The real-time usage metrics displayed in this tab page are accompanied by a miniature graph each. To analyze the time-of-day variations in any of these measures, click on the corresponding mini graph. Figure 18 will then appear. In the enlarged mode of the graph, you can study the dynamics of the chosen measure over the last 1 hour by default. Use the Timeline option in Figure 18 to change the period for which the graph is to be plotted. In case of a descriptor-based measure, by default, the graph of that measure will plot the values for all descriptors supported by that measure. This is why, the default selection in the Show drop-down (in Figure 18) is All. You can however, restrict the number and type of descriptors displayed in the graph by picking an option from the Show drop-down . From this drop-down , you can choose to view a specific number of best/worst performing descriptors alone in the graph.
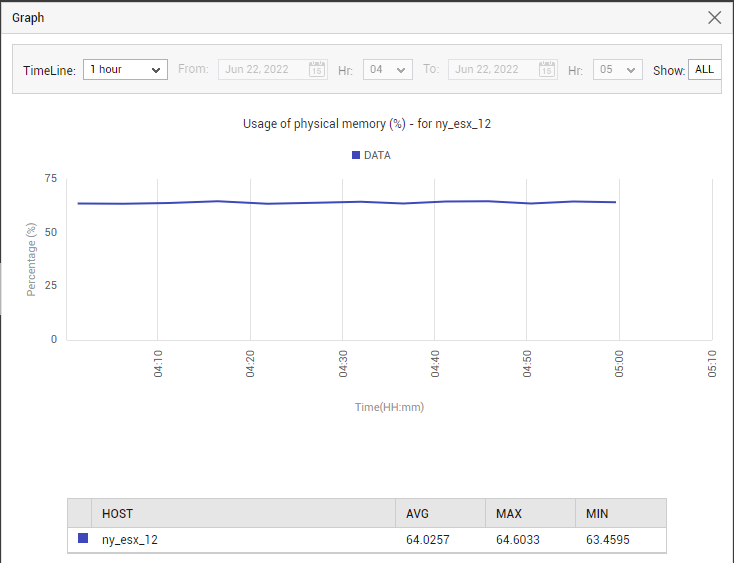
Figure 18 : An enlarged miniature graph in the Summary tab page of a chosen vSphere server
-
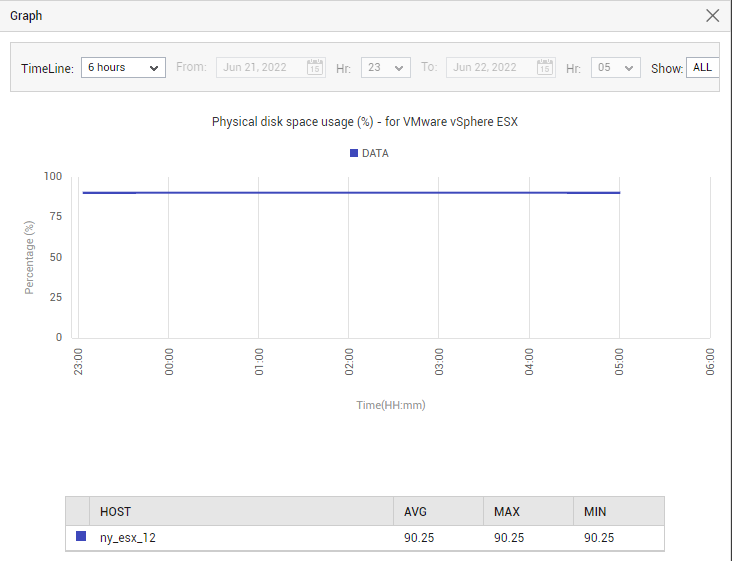
While the enlarged miniature graphs reveal how the default usage metrics behaved during the last hour (by default), the Graph section of the Summary tab page indicates how the same metrics behaved during the last 6 hours (by default). To magnify any of the graphs in the Graph section, click on that graph.Figure 19 will then appear.
-
In the enlarged mode, you can change the Timeline of the graph, and can also pick a different option from the Show drop-down to view only those descriptors of interest to you in the graph.
-
If you select the VMware vCenter node from the tree-structure in the left panel of the dashboard, the Summary tab page will provide an overview of the performance of the virtualized infrastructure managed by all monitored vCenter servers (in the chosen zone).
-
If you select a node representing a specific VMware vCenter server from the tree-structure, then the Summary tab page will change as depicted by Figure 20 below.
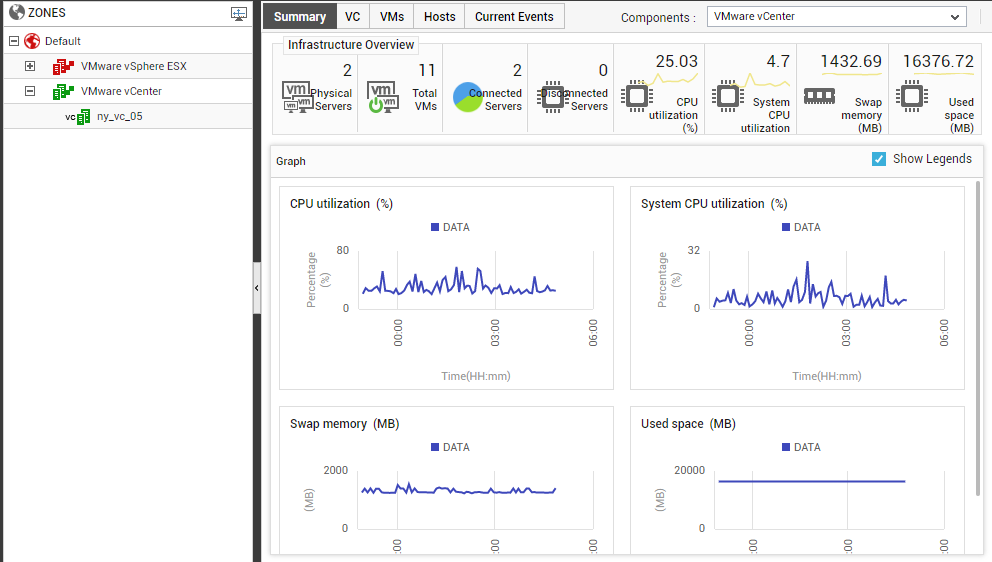
Figure 20 : The Summary tab page when a vCenter server is selected from the tree-structure
-
For a vCenter server, the Summary tab page displays the count of physical servers and VMs managed by that server. Additionally, it also displays how many vSphere/ESX servers are currently connected to and/or disconnected from the vCenter server. To know which servers are connected/disconnected, move your mouse pointer over the corresponding count displayed in Figure 20 (see Figure 21).
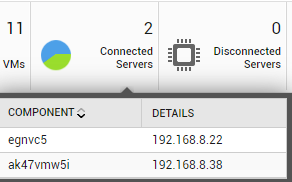
Figure 21 : The list of vSphere servers currently connected to the vCenter server
-
In addition, this tab page displays real-time values and historical graphs for a default set of key statistics related to the vCenter server. A quick look at this tab page will alert you to real/probable issues with any of the critical KPIs related to the vCenter server.
-
You can click on the miniature graph that accompanies a real-time measure displayed in Figure 20 to view a 1-hour graph on that measure. In the event that the measure reports an abnormality, this enlarged graph will help you determine if the issue occurred suddenly, sporadically, or consistently.
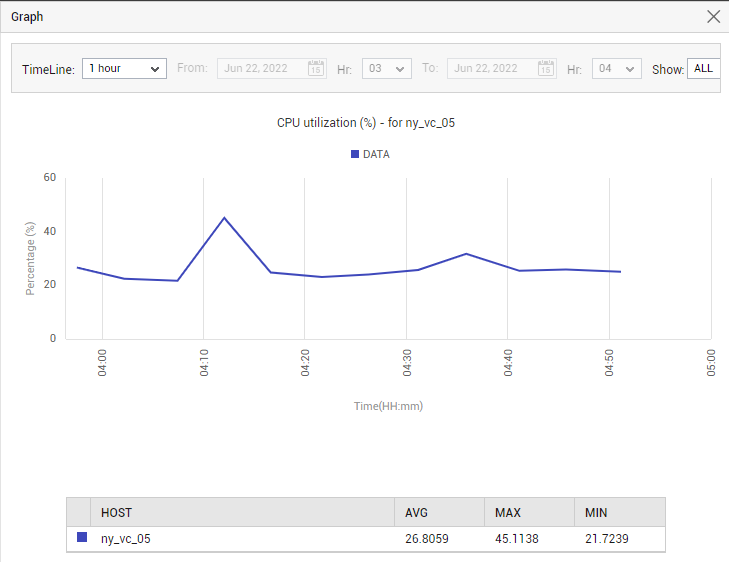
Figure 22 : Enlarging a miniature graph in the Summary tab page of a vCenter server
-
For a vCenter server also, the Summary tab page includes a Graph section. By default, this section includes 6-hour graphs for the same metrics for which current values are displayed at the top of the Summary tab page. These graphs will help you instantly analyze measure behavior over a 6-hour period, and deduce deviant performance patterns (if any). To enlarge a graph in this section, simply click on it. Figure 23 will then appear.
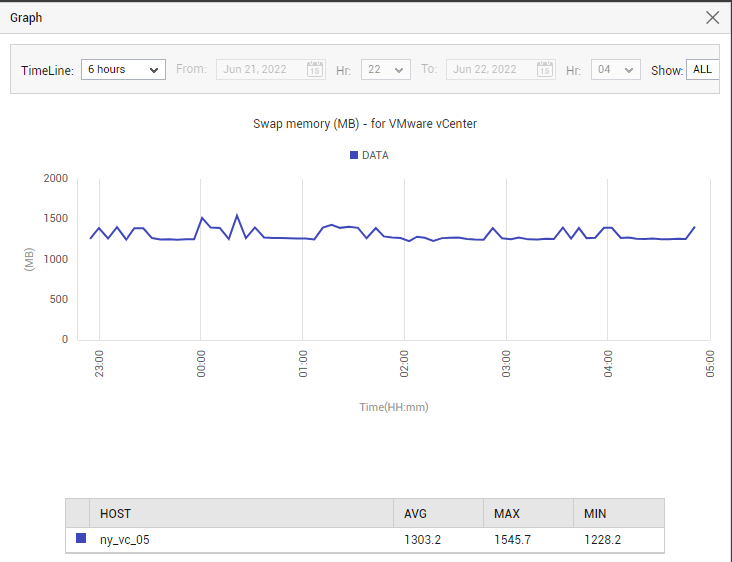
Figure 23 : Enlarging a graph in the Graph section of the Summary tab page of a vCenter server
-
Whether you enlarge a miniature graph, or one in the Graph section, in the magnified graph mode, you can change the Timeline of that graph. You can also pick a different option from the Show list, so you can historically analyze the performance of only those descriptors that are of interest to you.