The VMs Tab Page
The VMs tab page provides VM-centric information such as the name of the discovered VMs, the physical server on which each VM executes, and the metrics indicating how every VM uses its allocated and physical resources. Besides revealing resource-hungry VMs, this tab page also brings to light improper resource allocations to VMs.
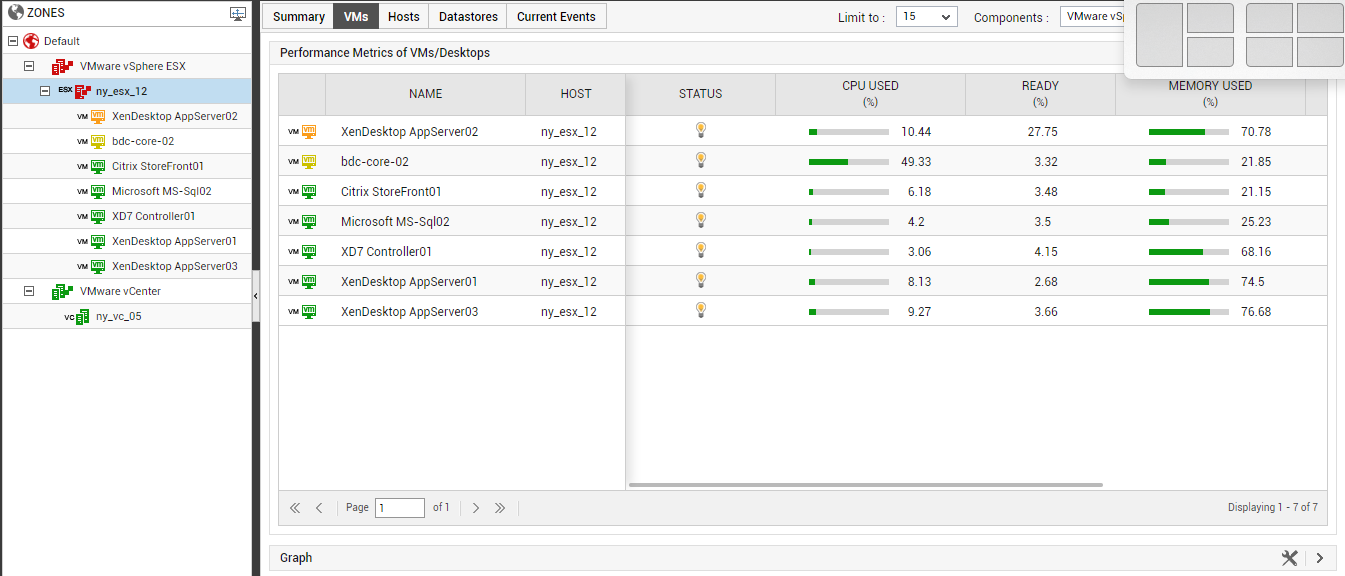
Figure 1 : The VMs tab page
The VMs listed in this tab page will change according to the node you choose from the tree-structure in the right panel.
|
Node chosen |
VMs displayed in the VMs tab page |
|
The global ZONES node |
All VMs running on managed hypervisors of the chosen type, across the environment |
|
A specific zone |
All VMs running on managed hypervisors of the chosen type in the selected zone |
|
Default zone |
All VMs running on managed hypervisors of the chosen type, which are not part of any zone |
|
Node representing a specific hypervisor type |
All VMs running on hypervisors of that type in the chosen zone |
|
Node representing a specific virtual host |
VMs running on that virtual host |
|
Node representing a VM |
The chosen VM |
|
Node representing a resource pool |
VMs in that resource pool |
|
Node representing a management server type (e.g., VMware vCenter) |
VMs running on hypervisors that are managed by all management servers of that type |
|
Node representing a management server of a specific type |
VMs running on hypervisors that are managed by that management server |
|
Node representing a virtual cluster |
VMs running on hypervisors that are part of the chosen cluster |
This tab page, by default, provides the details of those VMs that are executing on the managed VMware vSphere ESX servers in your environment. Similarly, the details of only the top-15 VMs (based on the powered state of the VMs) will be displayed in this tab page, by default. These default settings can however be overridden by following steps given below:
- Click on the
 button at the right, top corner of the VMs tab page.
 -
Figure 2 then appears.
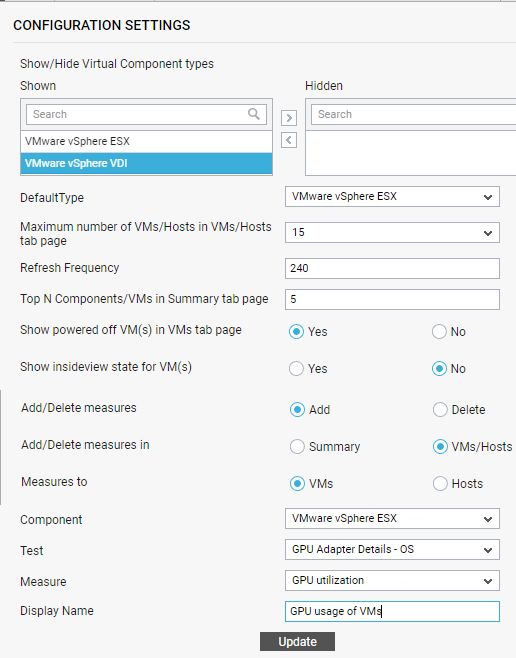
Figure 2 : Overriding the default measures displayed in the VMs tab page
- By default, the Maximum number of VMs/Hosts in VMs/Hosts tab page parameter is set to 15, indicating that the top-15 VMs are by default listed in the VMs tab page. You can override this default setting by changing the value of this parameter in Figure 2.
- Similarly, you will find that the DefaultType list is set to VMware vSphere ESX in Figure 2. This indicates that, by default, only those VMs that are executing on managed VMware vSphere ESX servers in the environment will be listed in the VMs tab page. To view details pertaining to the VMs on another virtualized component-type by default, select a different option from the DefaultType list.
- Finally, click the Update button in Figure 2.
By default, the VMs displayed in the vms tab page are sorted in the order of their powered state - i.e., the powered-off VMs will top the list, followed by the powered-on VMs. Sometimes, administrators may want to hide the details of powered-off VMs from the vms tab page, and instead view the resource usage metrics of the powered-on VMs alone. To enable this, follow the steps discussed below:
- Click on the button at the right, top corner of the VMs tab page.
-
Figure 2 then appears.
- By default, the Show powered off VM(s) in VMs tab page parameter is set to Yes, indicating that powered-off VMs are displayed in the VMs tab page by default. To hide powered-off VMs, set this flag to No.
- Finally, click the Update button to save the changes.
If state is the same across VMs, then the VMs are arranged in the order of their names. Against every VM listing, the state of the VM (whether powered on or off), the physical server on which the VM executes and the current resource usage metrics pertaining to each VM are displayed, so that administrators will be able to accurately identify powered-off VMs and resource-intensive VMs across all the managed physical servers (of the chosen type) in the environment, from just a quick glance. If required, you can sort the VM listing on the basis of any of the resource usage metrics. To change the sort order on-the-fly, click on the column head that represents the usage metric you want to sort on - for instance, to sort based on the CPU usage of the VMs, click on the column heading CPU used.
The resource usage metrics that accompany each VM displayed in this tab page are pre-configured in the eG Enterprise system. If need be, you can alter this default measure list, so that more useful measures are displayed per VM or one/more unnecessary measures are removed from the display. To effect this change, follow the steps given below:
-
Click on the
button at the right, top corner of the VMs tab page.
-
Figure 2 then appears. First, select the Add option from the Add/Delete measuressection. To add a new measure to the VMs tab page, then select the VM/Hosts option from the Add/Delete measures in section in Figure 2.
-
Then, select vms from the Measures to section.
-
Then, pick the virtualized Component type for which a measure is to be added to the vms tab page.
-
Select the Test that reports the measure.
-
Choose the Measure.
-
Provide a Display Name for the measure.
-
Finally, click the Update button in Figure 2 to save the changes.
-
To remove an existing measure from the vms tab page, select the Delete option from Add/Delete measures, pick the VMs/Hosts option from the Add/Delete measures in section, set the Measures to flag to VMs, select the Component type, pick the Test that reports the measure, pick the Measure, and click the Update button.
To zoom into the performance of a “powered on” VM, simply click on the VM Name in the right panel. This will invoke the Measures dashboard of Figure 3, displaying all the performance metrics extracted from that VM in real-time. You are thus enabled to cross-correlate across the various metrics, and quickly detect the root-cause of current/probable disturbances to the internal health of a VM.
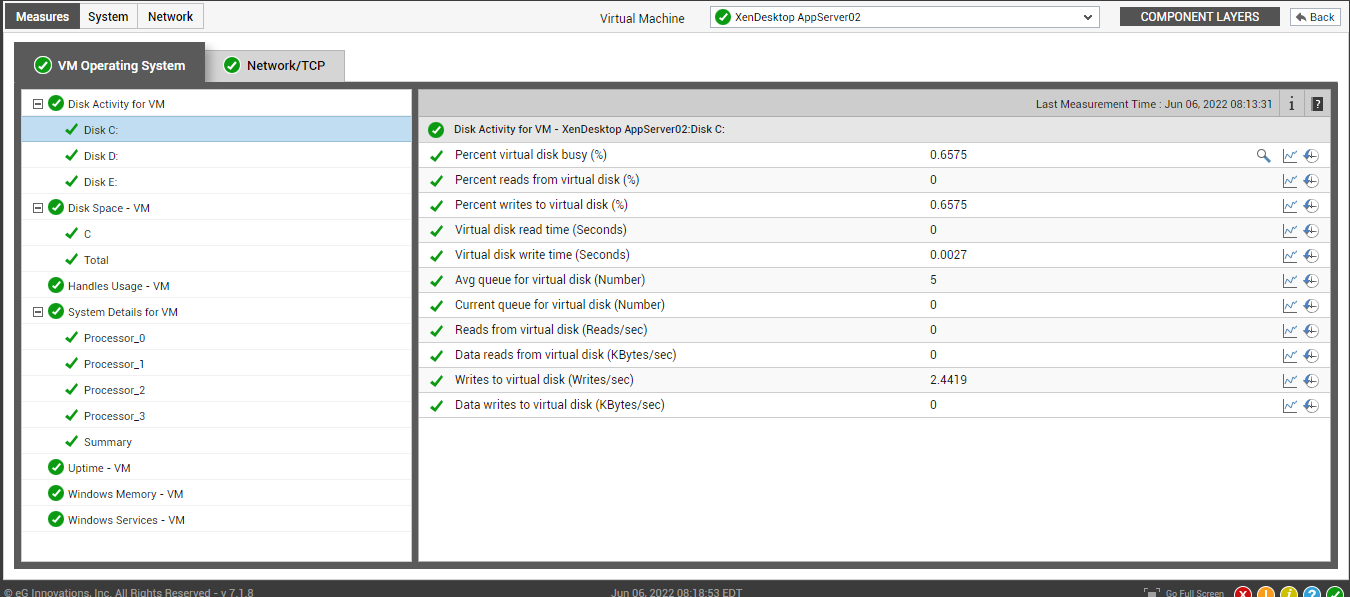
Figure 3 : The Measures dashboard appearing upon clicking a powered-on VM in the VMs tab page
If you click on the Name of a powered off VM in the VMs tab page, then Figure 3 will not appear. Instead, you will be lead to the layer model page of the physical server on which that VM is running.
Below the VMs list, you will find a Graph section (see Figure 4). To invoke this section, you need to click on the right-arrow icon at the end of it.
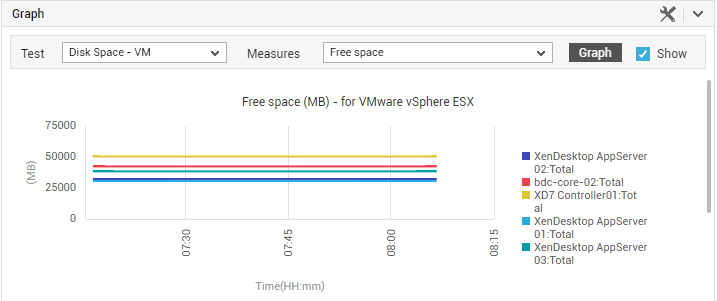
Figure 4 : The Graph section of the VMs tab page
For the VMs tab page, the Test list in this section will be populated with all those tests that report metrics for each VM on the virtual hosts of the chosen type. These tests will be sorted in the order of the test names, and the top test in the sorted test list will be selected by default in the Test list box. The Measures list naturally, will be populated with those metrics that the default Test reports. Since this list too is sorted in the order of the measure names, the top measure in the sorted list will be chosen by default in the Measures list. Using this graph, administrators can compare the performance of a particular measure across VMs, and accurately identify those VMs that are weak in a chosen performance arena. If need be, you can plot a comparison graph for a different Test-Measure pair, for a different timeline. To change the timeline, click on the  icon in the Graph section; the window depicted by Figure 5 will then pop out, allowing you to change the date and time.
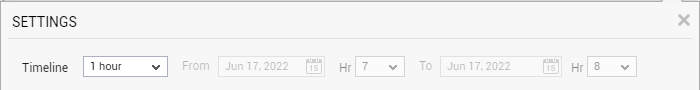
Figure 5 : The Timeline window
A legend is provided at the end of every graph clearly indicating which VM is represented using which color in the graph. This is accompanied by the Avg, Max, and Min values that the chosen Measure has recorded for every VM during the chosen Timeline. To view the legend, you can scroll down the Graph section (see Figure 6):
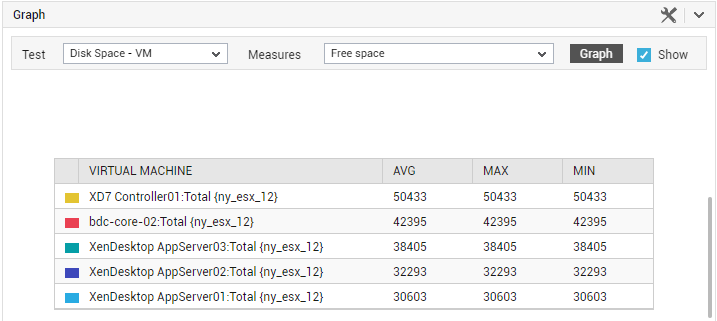
Figure 6 : The legend in the Graph section of the VMs tab page