
App Volume Details Test
In some virtual environments, RDS hosting of applications is performed using Omnissa App Volumes to remove, update, or install applications for users in real time. An Omnissa App Volume is a real-time application delivery system that enterprises can use to dynamically deliver and manage applications. Applications are bundled in AppStacks and delivered by attaching a standard VMDK file to a virtual machine. The Appstacks are provisioned to the target RDS server using App Volumes Manager (Web-based interface) that is integrated with Active Directory (AD) and vSphere. The App Volumes Manager centrally manages the applications, Appstacks and App Volumes. The 24x7 availability of the App Volumes Manager is imperative to ensure that users have uninterrupted access to the AppStacks that are attached when a user logs in to the target RDS server. If the App Volumes Manager is inaccessible or an AppStack is not attached on time or not attached properly, then, the user experience in accessing the AppStack may seriously suffer. This in turn can impact the productivity of the users and overall user experience with the RDS server. To avoid such inconveniences, it is important for the administrators to continuously monitor the availability of App Volumes Manager and Appstacks attachment to the RDS server. This can be easily achieved using the App Volume Details test.
This test instantly reveals the inaccessibility of the App Volumes Manager which helps administrators to quickly resolve the issue and restore the availability of the App Volumes Manager before the users complain. In the process, this test also reports whether/not all the Appstacks are attached to the RDS server. This way, the test informs administrators of non-attachment of Appstacks (if any). In addition, this test reports the number of Appstacks attached, the applications attached with the Appstacks and the time taken for attaching the Appstacks. By analyzing these measures, administrators can figure out if the Appstacks attachment took longer time than expected, and if it too long, initiate remedial measures to fix the same.
Note:
This test will report the measures only if the applications are provisioned to the target RDS server through Omnissa App Volumes Manager.
Target of the test : An Omnissa Horizon RDS server
Agent deploying the test: An external agent
Outputs of the test : One set of results for the Omnissa Horizon RDS server being monitored.
| Parameters | Description |
|---|---|
|
Test Period |
This indicates how often should the test be executed. |
|
Host |
The host for which the test is to be configured. |
|
Port |
Refers to the port used by the Omnissa Horizon RDS server. By default, this is set to 4172. |
|
DD Frequency |
Refers to the frequency with which detailed diagnosis measures are to be generated for this test. The default is 1:1. This indicates that, by default, detailed measures will be generated every time this test runs, and also every time the test detects a problem. You can modify this frequency, if you so desire. Also, if you intend to disable the detailed diagnosis capability for this test, you can do so by specifying none against DD frequency. |
|
Detailed Diagnosis |
To make diagnosis more efficient and accurate, the eG Enterprise embeds an optional detailed diagnostic capability. With this capability, the eG agents can be configured to run detailed, more elaborate tests as and when specific problems are detected. To enable the detailed diagnosis capability of this test for a particular server, choose the On option. To disable the capability, click on the Off option. The option to selectively enable/disable the detailed diagnosis capability will be available only if the following conditions are fulfilled:
|
| Measurement | Description | Measurement Unit | Interpretation | ||||||
|---|---|---|---|---|---|---|---|---|---|
|
Is App Volume manager accessible? |
Indicates whether the App Volumes Manager is currently accessible or not. |
|
The values reported by this measure and its numeric equivalents are mentioned in the table below:
Note: By default, this measure reports the Measure Values listed in the table above to indicate the current accessibility status of the App Volumes Manager. The graph of this measure however, is represented using the numeric equivalents only. The detailed diagnosis of this measure reveals the details of the Apps Volume Manager. |
||||||
|
Total AppStacks attached |
Indicates the total number of AppStacks attached to the target RDS server. |
Number |
Appstack is a read-only volume containing one or more Windows applications. Once provisioned, an individual AppStack or multiple AppStacks can be mapped to a user, a group of users, or computers at login, or in real-time and to computers only at the time of startup. The detailed diagnosis of this measure displays the details of the Appstacks attached to the App Volumes Manager. |
||||||
|
Total applications attached in AppStacks |
Indicates the total number of applications attached in the AppStacks that have been attached to the target RDS server. |
|
The detailed diagnosis of this measure displays the details of the applications bundled in the Appstacks. |
||||||
|
Are all AppStacks attached? |
Indicates whether/not all the appstacks are attached to the the target RDS server. |
|
The values reported by this measure and its numeric equivalents are mentioned in the table below:
Note: By default, this measure reports the Measure Values listed in the table above to indicate whether all Appstacks are attached to the App Volumes Manager or not. The graph of this measure however, is represented using the numeric equivalents only. |
||||||
|
All AppStacks attachment time |
Indicates the time taken for attaching the Appstacks to the target RDS server. |
Seconds |
Ideally, a low value is desired for this measure. |
||||||
|
Total App Volumes attached duration |
Indicates the time taken for attaching the App Volumes to the target RDS server. |
Seconds |
The detailed diagnosis of this measure revelas the details of the App Volumes attached to target RDS server. |
The detailed diagnosis capability of the Is App Volume manager accessible? measure, reveals the IP address detail of the Apps Volume Manager.

Figure 1 : The detailed diagnosis of the Is App Volume manager accessible? measure
The detailed diagnosis capability of the Total AppStacks attached measure, reveals the IP address detail of the Apps Volume Manager.

Figure 2 : The detailed diagnosis of the Total AppStacks attached measure
The detailed diagnosis capability of the Total applications attached in AppStacks measure, reveals the name of the Appstack to which the applications are bundled with, name and version of the applications, and the name of the application publishers.
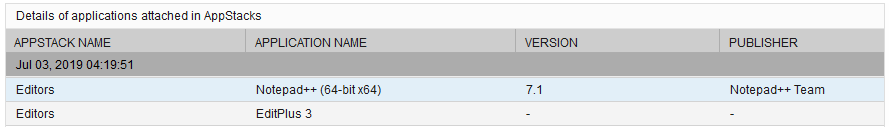
Figure 3 : The detailed diagnosis of the Total applications attached in AppStacks measure
The detailed diagnosis of the All AppStacks attachment time measure, displays the time taken during at which each Appstack was attached.
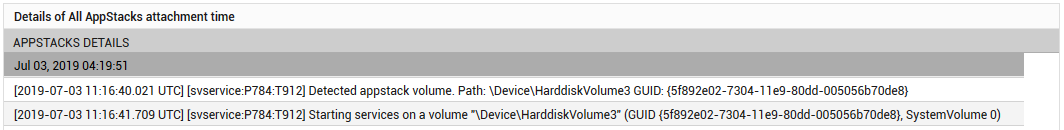
Figure 4 : The detailed diagnosis of the All AppStacks attachment time measure
