
Monitoring the Omnissa Horizon RDS
The eG Enterprise offers 100% web-based monitoring of application delivery via View’s RDS hosting option. For this purpose, eG Enterprise provides a specialized Omnissa Horizon RDS monitoring model. This model defines the key performance metrics that need to be tracked to determine the service level achieved by View’s RDS farms.
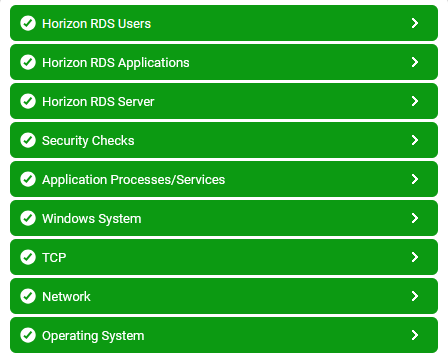
Figure 1 : Layer model of Omnissa Horizon RDS
Each layer of the Figure 1 is mapped to a variety of tests that provide valuable insights into the overall health and performance of the RDS farm. With the help of the metrics reported by these tests, you can find quick and accurate answers for the following queries:
|
Omnissa Horizon RDS server Monitoring |
Are the Omnissa Horizon RDS servers available to service user requests? Are there sporadic disconnects from the Omnissa Horizon RDS server? At what times do peak usage of the servers happen and is the server capacity adequate? Is the user load being balanced across all the servers? |
|
User Monitoring |
Are users able to login to the server farm? How long is the login process taking? What is the average response time that a user sees when connecting to a Omnissa Horizon RDS server? How many users are logged in to each server in the Omnissa Horizon RDS server farm? What is the I/O activity generated by every user? How much network bandwidth is consumed by every user? Are too many page faults occurring in the processes executed on a server? If so, what are those processes, and who are the users executing them? Which user is using a lot of handles? |
|
Operating System Monitoring |
What is the average CPU and memory usage on all the servers in the farm? Is any unusual memory scanning/paging activity happening on the systems? Are the critical Omnissa Horizon RDS server processes up? What is their resource consumption? |
|
Hosted Application Monitoring |
What are the applications hosted on a Omnissa Horizon RDS server? Who is using each application? What is the resource usage for each published application? |
