Datastores Test
This test auto-discovers the datastores available in each datacenter managed by VC, and reports the availability and resource usage of every datastore.
Target of the test : A VMware vCenter server
Agent deploying the test : An internal agent
Outputs of the test : One set of results for the every datacenter:datastore combination being monitored.
| Parameter | Description |
|---|---|
|
Test Period |
How often should the test be executed. |
|
Host |
The host for which this test is to be configured. |
|
Port |
Refers to the port at which the specified host listens to. |
|
VC User and VC Password |
To connect to vCenter and extract metrics from it, this test should be configured with the name and password of a user with Administrator or Virtual Machine Administrator privileges to vCenter. However, if, owing to security constraints, you are not able to use the credentials of such users for test configuration, then you can configure this test with the credentials of a user with Read-only rights to vCenter. For this purpose, you can assign the ‘Read-only’ role to a local/domain user to vCenter, and then specify name and password of this user against the VC User and VC Password text boxes. The steps for assigning this role to a user on vCenter have been detailed in vCenter servers terminate user sessions based on timeout periods. The default timeout period is 30 mins. When you stop an agent, sessions currently in use by the agent will remain open for this timeout period until vCenter times out the session. If the agent is restarted within the timeout period, it will open a new set of sessions. If you want the eG agent to close already existing sessions on vCenter before it opens new sessions, then, instead of the ‘Read-only’ user, you can optionally configure the VC User and VC Password parameters with the credentials of a user with permissions to View and Stop Sessions on vCenter. For this purpose, you can create a special role on vCenter, grant the View and Stop Sessions privilege (prior to vCenter 4.1, this was called the View and Terminate Sessions privilege) to this role, and then assign the new role to a local/domain user to vCenter. The steps for assigning this role to a user on vCenter have been detailed in |
|
Confirm Password |
Confirm the password by retyping it in this text box. |
|
SSL |
By default, the vCenter server is SSL-enabled. Accordingly, the SSL flag is set to Yes by default. This indicates that the eG agent will communicate with the vCenter server via HTTPS by default. |
|
Webport |
By default, in most virtualized environments, vCenter listens on port 80 (if not SSL-enabeld) or on port 443 (if SSL-enabled) only. This implies that while monitoring vCenter, the eG agent, by default, connects to port 80 or 443, depending upon the SSL-enabled status of vCenter – i.e., if vCenter is not SSL-enabled (i.e., if the SSL flag above is set to No), then the eG agent connects to vCenter using port 80 by default, and if vCenter is SSL-enabled (i.e., if the ssl flag is set to Yes), then the agent-vCenter communication occurs via port 443 by default. Accordingly, the Webport parameter is set to default by default. In some environments however, the default ports 80 or 443 might not apply. In such a case, against the Webport parameter, you can specify the exact port at which vCenter in your environment listens, so that the eG agent communicates with that port for collecting metrics from vCenter. |
|
Report Datacenter |
By default, this test reports the metrics for each datacenter:datastore combination. Therefore, this parameter is set to Yes. |
|
Detailed Diagnosis |
To make diagnosis more efficient and accurate, the eG Enterprise embeds an optional detailed diagnostic capability. With this capability, the eG agents can be configured to run detailed, more elaborate tests as and when specific problems are detected. To enable the detailed diagnosis capability of this test for a particular server, choose the On option. To disable the capability, click on the Off option. The option to selectively enable/disable the detailed diagnosis capability will be available only if the following conditions are fulfilled:
|
| Measurement | Description | Measurement Unit | Interpretation | ||||||||||||||||||||||||||||||||
|---|---|---|---|---|---|---|---|---|---|---|---|---|---|---|---|---|---|---|---|---|---|---|---|---|---|---|---|---|---|---|---|---|---|---|---|
|
Esx servers using the datastore |
Indicates the number of ESX servers that are currently using this datastore. |
Number |
A single datastore can be used by both the ESX servers and the VMs executing on them. Use the detailed diagnosis capability of each of these measures to know which ESX servers and VMs are currently using this datastore. |
||||||||||||||||||||||||||||||||
|
VMs using the datastore |
Indicates the number of VMs that are currently using this datastore. |
Number |
|||||||||||||||||||||||||||||||||
|
Physical disk capacity |
Indicates the total capacity of the datastore. |
MB |
|
||||||||||||||||||||||||||||||||
|
Used space |
Indicates the space in the datastore that is currently in use. |
MB |
|
||||||||||||||||||||||||||||||||
|
Free space |
Indicates the space currently available for use in the datastore. |
MB |
|
||||||||||||||||||||||||||||||||
|
Physical disk space usage |
Indicates the percentage of datastore space utilized. |
Percent |
A high value is indicative of excessive usage of disk space by this datastore. Comparing the value of this measure across datastores will enable administrators identify resource-intensive datastores. |
||||||||||||||||||||||||||||||||
|
Datastore availability |
Indicates whether this datastore is available or not. |
Percent |
While the value 0 indicates that the datastore is not available, the value 100 indicates that the datastore is currently available. If a datastore becomes unavailable, then VMs that are currently using that datastore could be rendered inaccessible to users. Using the detailed diagnosis of this measure, you can identify the vSphere hosts that are using this datastore, the LUN name and drive type of the datastore, and can also ascertain how space in the datastore is being utilized. |
||||||||||||||||||||||||||||||||
|
Allocated space |
Indicates the amount of physical space provisioned by an administrator for this datastore. |
MB |
This measure reports the storage size up to which files on this datastore can be stacked. |
||||||||||||||||||||||||||||||||
|
Average write requests rate |
Indicates the average number of write commands issued per second to this datastore. |
Commands/Sec |
By comparing the values of these measures across datastores, you can accurately identify those datastores that are overloaded with read/write requests. |
||||||||||||||||||||||||||||||||
|
Average read requests rate |
Indicates the average number of read commands issued per second to this datastore. |
Commands/Sec |
|||||||||||||||||||||||||||||||||
|
Write latency |
Indicates the average amount of time taken to write to this datastore. |
Secs |
Very high values for these measures are indicative of processing bottlenecks in the datastore. Compare the values of these measures across datastores to determine which datastore is experiencing the maximum latency. |
||||||||||||||||||||||||||||||||
|
Read latency |
Indicates the average amount of time taken to read from this datastore. |
Secs |
|||||||||||||||||||||||||||||||||
|
Read rate |
Indicates the rate at which data is read from this datastore. |
MB/Sec |
|
||||||||||||||||||||||||||||||||
|
Write rate |
Indicates the rate at which data is written to this datastore. |
MB/Sec |
|
||||||||||||||||||||||||||||||||
|
Storage I/O control normalized latency |
Indicates the device latency that the host observes while communicating with this datastore; this latency is a normalized average across virtual machines |
Secs |
Storage I/O Control allows cluster-wide storage I/O prioritization, which allows better workload consolidation and helps reduce extra costs associated with over provisioning. When you enable Storage I/O Control on a datastore, ESX/ESXi begins to monitor the device latency that hosts observe when communicating with that datastore. When device latency exceeds a threshold, the datastore is considered to be congested and each virtual machine that accesses that datastore is allocated I/O resources in proportion to their shares. You set shares per virtual machine. You can adjust the number for each based on need. |
||||||||||||||||||||||||||||||||
|
Storage I/O control aggregated IOPS |
Indicates the aggregate number of I/O operations that are occurring on this datastore. |
Number |
|
||||||||||||||||||||||||||||||||
|
Storage I/O Control active time |
Indicates whether storage I/O control (SIOC) is active on this datastore or not. |
Percent |
Storage I/O Control (SIOC) is used to provide I/O prioritization of virtual machines running on a group of VMware vSphere hosts that have access to a shared storage pool. It extends the familiar constructs of shares and limits, which exist for CPU and memory, to address storage utilization through a dynamic allocation of I/O capacity across a cluster of vSphere hosts. If SIOC is active, the value of this measure will be 100%. If it is not active, the value of this measure will be 0. |
||||||||||||||||||||||||||||||||
|
Total IOPS |
Indicates the total number of read and write commands issued per second to this datastore. |
Commands/Sec |
Compare the value of this measure across datastores to identify the busiest datastore in terms of the rate at which read/write commands are issued on it. A consistent increase in the value of this measure for a particular datastore could indicate a potential I/O overload. |
||||||||||||||||||||||||||||||||
|
Total latency |
Indicates the total amount of time taken to read and write to this datastore. |
Secs |
Ideally, the value of this measure should be low. A high value could indicate an I/O processing bottleneck. By comparing the value of this measure across datastore, you can quickly identify which datastore is the most latent. Such datastores are ideal candidates for enabling SIOC. EnablingIOC on a datastore triggers the the monitoring of device latency that hosts observe when communicating with that datastore. When latency exceeds a set threshold the feature engages automatically as the datastore is experiencing congestion. Each virtual machine that accesses that datastore is then allocated I/O resources in proportion to their shares. |
||||||||||||||||||||||||||||||||
|
Throughput |
Indicates the rate at which the data is read and written to this datastore. |
MB/Sec |
Ideally, the value of this measure should be high. A steady decrease in the value of this measure could indicate that the datastore is experiencing a congestion. You may want to enable SIOC on such datastores, so that when latency exceeds a set threshold the SIOC feature engages automatically and then allocates I/O resources to each VM that acceses that datastore in proportion to their shares. |
||||||||||||||||||||||||||||||||
|
Type
|
Indicates the type of file system this datastore supports.
|
|
The values that this measure can report are listed below, along with their descriptions:
The numeric values that correspond to each of the Measure Values listed above are as follows:
Note: By default, this measure reports the Measure Values listed in the table above. In the graph of this measure however, the file system type of the datastore is represented using the corresponding numeric equivalents only. |
The detailed diagnosis of the ESX servers using the datastore measure lists the ESX servers that are using this datastore.

Figure 1 : The detailed diagnosis of the ESX servers using the datastore measure
The detailed diagnosis of the VMs using the datastore measure lists the VMs that are currently using this datastore.
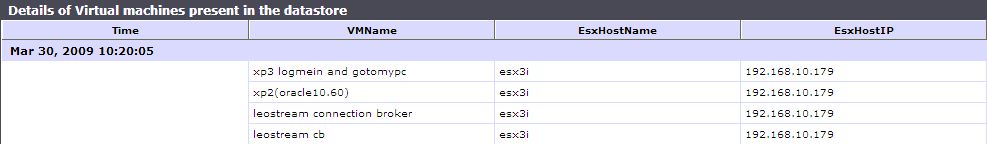
Figure 2 : The detailed diagnosis of the VMs using the datastore measure