Virtual Clusters Test
This test reports key metrics pertaining to the resource availability and resource usage of the ESX server clusters managed by vCenter.
Target of the test : A VMware vCenter server
Agent deploying the test : An internal agent
Outputs of the test : One set of results for every datacenter::clustername pair managed by vCenter.
| Parameter | Description |
|---|---|
|
Test Period |
How often should the test be executed. |
|
Host |
The host for which this test is to be configured. |
|
Port |
Refers to the port at which the specified host listens to. |
|
VC User and VC Password |
To connect to vCenter and extract metrics from it, this test should be configured with the name and password of a user with Administrator or Virtual Machine Administrator privileges to vCenter. However, if, owing to security constraints, you are not able to use the credentials of such users for test configuration, then you can configure this test with the credentials of a user with Read-only rights to vCenter. For this purpose, you can assign the ‘Read-only’ role to a local/domain user to vCenter, and then specify name and password of this user against the VC User and VC Password text boxes. The steps for assigning this role to a user on vCenter have been detailed in vCenter servers terminate user sessions based on timeout periods. The default timeout period is 30 mins. When you stop an agent, sessions currently in use by the agent will remain open for this timeout period until vCenter times out the session. If the agent is restarted within the timeout period, it will open a new set of sessions. If you want the eG agent to close already existing sessions on vCenter before it opens new sessions, then, instead of the ‘Read-only’ user, you can optionally configure the VC User and VC Password parameters with the credentials of a user with permissions to View and Stop Sessions on vCenter. For this purpose, you can create a special role on vCenter, grant the View and Stop Sessions privilege (prior to vCenter 4.1, this was called the View and Terminate Sessions privilege) to this role, and then assign the new role to a local/domain user to vCenter. The steps for assigning this role to a user on vCenter have been detailed in |
|
Confirm Password |
Confirm the password by retyping it in this text box. |
|
SSL |
By default, the vCenter server is SSL-enabled. Accordingly, the SSL flag is set to Yes by default. This indicates that the eG agent will communicate with the vCenter server via HTTPS by default. |
|
Webport |
By default, in most virtualized environments, vCenter listens on port 80 (if not SSL-enabeld) or on port 443 (if SSL-enabled) only. This implies that while monitoring vCenter, the eG agent, by default, connects to port 80 or 443, depending upon the SSL-enabled status of vCenter – i.e., if vCenter is not SSL-enabled (i.e., if the SSL flag above is set to No), then the eG agent connects to vCenter using port 80 by default, and if vCenter is SSL-enabled (i.e., if the ssl flag is set to Yes), then the agent-vCenter communication occurs via port 443 by default. Accordingly, the Webport parameter is set to default by default. In some environments however, the default ports 80 or 443 might not apply. In such a case, against the Webport parameter, you can specify the exact port at which vCenter in your environment listens, so that the eG agent communicates with that port for collecting metrics from vCenter. |
|
Detailed Diagnosis |
To make diagnosis more efficient and accurate, the eG Enterprise embeds an optional detailed diagnostic capability. With this capability, the eG agents can be configured to run detailed, more elaborate tests as and when specific problems are detected. To enable the detailed diagnosis capability of this test for a particular server, choose the On option. To disable the capability, click on the Off option. The option to selectively enable/disable the detailed diagnosis capability will be available only if the following conditions are fulfilled:
|
|
Measurement |
Description |
Measurement Unit |
Interpretation |
||||||
|---|---|---|---|---|---|---|---|---|---|
|
Physical CPU available to cluster |
Indicates the aggregated CPU resources of all hosts in the cluster. |
Mhz |
This measure is the sum total of CPU resources of all hosts in the cluster. The maximum value is equal to the frequency of the processors multiplied by the number of cores. |
||||||
|
Effective CPU available to cluster |
Indicates the effective CPU resources currently available to run virtual machines. |
Mhz |
This is the aggregated effective resource level from all running hosts. Hosts that are in maintenance mode or unresponsive are not counted. Resources used by VMware Service console are not included in the aggregate. This value represents the amount of resources available for the root resource pool for running virtual machines. |
||||||
|
Physical CPU usage of VMs in cluster |
Indicates the current physical CPU usage of the VMs in the cluster in Mhz. |
Mhz |
|
||||||
|
Physical CPU used by VMs |
Indicates the percentage of physical CPU resources utilized by the VMs in the cluster. |
Percent |
Ideally, a cluster should use only a small percentage of the aggregated physical CPU resources of all the hosts within. High CPU usage by one/more hosts in a cluster could drain the physical resources of other hosts in the cluster, thereby affecting the performance of the applications executing on their VMs. In the event of excessive CPU usage by a cluster, it is therefore imperative that you quickly identify which hosts in the cluster, and which VMs on those hosts are responsible for the CPU drain. For this purpose, you can use the detailed diagnosis of this measure, which reveals the VMs in the cluster and the CPU usage of each VM; this way, you can rapidly isolate resource-intensive VMs. |
||||||
|
Effective CPU cycles available to the cluster |
Indicates the unused CPU currently available with the cluster. |
Mhz |
This is the difference between the effective CPU resources available with the cluster for running VMs and the effective CPU resources used by the cluster. Ideally, the value of this measure should be high. A very low value or a value that consistently sinks could be a cause for concern, as it could indicate a CPU resource contention on the cluster. |
||||||
|
Total physical memory available to cluster |
Indicates the aggregated memory resources of all hosts in the cluster. |
MB |
|
||||||
|
Effective memory available to cluster |
Indicates the effective memory resources currently available to run virtual machines. |
MB |
This is the aggregated effective resource level from all running hosts. Hosts that are in maintenance mode or unresponsive are not counted. Resources used by VMware Service console are not included in the aggregate. This value represents the amount of resources available for the root resource pool for running virtual machines. |
||||||
|
Consumed memory of host in cluster |
Indicates the amount of memory currently used by the hosts in the cluster. |
MB |
|
||||||
|
Physical memory used |
Indicates the percentage of physical memory resources utilized by the cluster. |
Percent |
Ideally, a cluster should use only a small percentage of the aggregated physical memory resources of all the hosts within. High memory usage by one/more hosts in a cluster could drain the physical resources of other hosts in the cluster, thereby affecting the performance of the applications executing on their VMs.
|
||||||
|
Total CPU cores for cluster |
Indicates the number of physical CPU cores currently within the cluster; these are the processes contained by the CPU package. |
Number |
|
||||||
|
Total physical hosts in cluster |
Indicates the total number of physical hosts in the cluster, currently. |
Number |
The detailed diagnosis of this measure, if enabled, reveals the name and IP address of the physical hosts in the cluster. |
||||||
|
Number of effective hosts in cluster |
Indicates the total number of effective hosts in the cluster, currently. |
Number |
|
||||||
|
VMs in cluster |
Indicates the number of VMs in the cluster. |
Number |
The detailed diagnosis of this measure, if enabled, reveals the name of the VM, the ESX server on which the VM is executing, and and IP address of the ESX server. |
||||||
|
VMs powered on |
Indicates the total number of VMs that are currently powered-on in the cluster. |
Number |
The detailed diagnosis of this measure, if enabled, reveals the details of the powered-on VMs. |
||||||
|
VMs powered off |
Indicates the total number of VMs that are currently powered-off in the cluster. |
Number |
|
||||||
|
VMs suspended |
Indicates the number of VMs that are currently in a suspended state in the cluster. |
Number |
|
||||||
|
Effective CPU Reserved |
Indicates the total amount of CPU resources that have been used to satisfy the reservation requirements of child resource pool and VMs. |
Mhz |
|
||||||
|
Effective CPU Not Reserved |
Indicates the amount of effective CPU resources with the cluster that are currently unused. |
Mhz |
Ideally, the value of this measure should be high. |
||||||
|
CPU Reserved for VMs in Cluster |
Indicates the total amount of CPU reserved for VMs in the cluster. |
Mhz |
Use the detailed diagnosis of this measure to figure out how much CPU has been reserved for each of the VMs in the cluster. |
||||||
|
CPU Reserved for Direct Pools in Cluster |
Indicates the total amount of CPU resources reserved by the direct pools in the cluster. |
Mhz |
Use the detailed diagnosis of this measure to figure out how much CPU has been reserved by each of the direct pools in the cluster. |
||||||
|
CPU used by direct Pools in Cluster |
Indicates the amount of CPU currently used by direct pools in the cluster. |
Mhz |
In the event of abnormal CPU usage at the pool-level, use the detailed diagnosis of this measure to identify which direct pool is consuming CPU excessively. |
||||||
|
Effective Memory Reserved |
Indicates the total amount of memory resources that have been used to satisfy the reservation requirements of child resource pool and VMs. |
MB |
|
||||||
|
Effective Memory Not Reserved |
Indicates the amount of effective memory resources with the cluster that are currently unused. |
MB |
Ideally, the value of this measure should be high. |
||||||
|
Memory Reserved for VMs in Cluster |
Indicates the total amount of memory reserved for VMs in the cluster. |
MB |
Use the detailed diagnosis of this measure to figure out how much memory has been reserved for each of the VMs in the cluster. |
||||||
|
Memory Reserved for direct Pools in Cluster |
Indicates the total amount of memory resources reserved by the direct pools in the cluster. |
MB |
Use the detailed diagnosis of this measure to figure out how much memory has been reserved by each of the direct pools in the cluster. |
||||||
|
Memory consumed for direct Pools in Cluster |
Indicates the amount of memory currently used by direct pools in the cluster. |
MB |
A high value is indicative of excessive memory usage by the direct pools in the cluster. In such circumstances, take the help of the detailed diagnosis capability of this measure to quickly zero-in on that direct pool that consumes maximum memory. |
||||||
|
Memory consumed by VMs in Cluster |
The total amount of memory currently consumed by the VMs in the cluster. |
MB |
A high value is indicative of excessive memory usage by the VMs in the cluster. In such circumstances, take the help of the detailed diagnosis capability of this measure to quickly zero-in on that VM that consumes maximum memory. |
||||||
|
Total migrations by VMotion |
Indicates the total number of migrations with VMotion that have been done internal to this cluster. |
Number |
|
||||||
|
HA enabled |
Indicates whether/not this cluster is HA-enabled. |
|
If vSphere HA (High Availability) is enabled on a cluster, then vSphere will provide high availability for virtual machines on the cluster. Hosts in the cluster are monitored and in the event of a failure, the virtual machines on a failed host are restarted on alternate hosts. If vSphere HA is enabled on a cluster, then the value of this measure will be Yes. If not, then this measure will report the value No. The numeric values that correspond to these measure values are discussed in the table below:
Note: By default, this measure reports the Measure Values listed in the table above. In the graph of this measure however, the vSphere HA state is represented using the corresponding numeric equivalents only. |
||||||
|
DPM enabled |
Indicates whether/not the DPM service is enabled for this cluster. |
|
VMware Distributed Power Management (VMware DPM) provides additional power savings by dynamically right-sizing cluster capacity according to workload demands. VMware DPM recommends the evacuation and powering off of ESX hosts when both CPU and memory resources are lightly utilized. VMware DPM recommends powering ESX hosts back on when either CPU or memory resource utilization increases appropriately or additional host resources are needed to meet VMware HA or user-specified constraints. VMware DPM executes VMware DRS in a what-if mode to ensure its host power recommendations are consistent with the cluster constraints and objectives being managed by VMware DRS. Since VMware DPM works in conjunction with VMware DRS, this measure will report a value only if the ‘DRS enabled’ measure reports the value ‘Yes’. If DPM is enabled for a cluster, then the value of this measure will be Yes. If not, then the measure will report the value No. The numeric values that correspond to these measure values are discussed in the table below:
Note: By default, this measure reports the Measure Values listed in the table above. In the graph of this measure however, the vSphere DPM state is represented using the corresponding numeric equivalents only. |
||||||
|
DRS enabled |
Indicates whether/not the DRS service is enabled for this cluster. |
|
DRS (Dynamic Resource Scheduler) is a powerful feature that enables your virtual environment to automatically balance itself across your ESX host servers in an effort to eliminate resource contention. It utilizes the VMotion feature to provide automated resource optimization through automatic migration of VMs across hosts in a cluster. DRS also provides automatic initial VM placement on any of the hosts in the cluster, and makes automatic resource relocation and optimization decisions as hosts or VMs are added to or removed from the cluster. You can also configure DRS for manual control so that it only provides recommendations that you can review and carry out. DRS works by utilizing resource pools and clusters that combine the resources of multiple hosts into a single entity. When a VM experiences increased load, DRS first evaluates its priority against the established resource allocation rules and then, if justified, redistributes VMs among the physical servers to try to eliminate contention for resources. VMotion will then handle the live migration of the VM to a different ESX host with complete transparency to end users. The dynamic resource allocation ensures that capacity is preferentially dedicated to the highest-priority applications, while at the same time maximizing overall resource utilization. If DRS is enabled for a cluster, then the value of this measure will be Yes. If not, then the measure will report the value No. The numeric values that correspond to these measure values are discussed in the table below:
Note: By default, this measure reports the Measure Values listed in the table above. In the graph of this measure however, the vSphere DRS state is represented using the corresponding numeric equivalents only. |
||||||
|
vSAN service enabled |
Indicates whether/not the vSAN service is enabled for this cluster. |
|
Virtual SAN virtualizes local physical storage resources of vSphere hosts and turns them into pools of storage that can be carved up and assigned to virtual machines and applications according to their quality of service requirements. You can activate Virtual SAN when you create host clusters or enable Virtual SAN on existing clusters. When enabled, Virtual SAN aggregates all local storage disks available on the hosts into a single datastore shared by all hosts. You can later expand the datastore by adding storage devices or hosts to the cluster. If vSAN is not enabled for a cluster, then the value of this measure will be No. If vSAN is enabled, then the value of this measure will be Yes. The numeric values that correspond to these measure values are discussed in the table below:
Note: By default, this measure reports the Measure Values listed in the table above. In the graph of this measure however, the state of the vSAN is represented using the corresponding numeric equivalents only. |
||||||
|
Hosts in not responding state |
Indicates the number of hosts that are currently in not responding state. |
Number |
The detailed diagnosis of this measure measure, if enabled, reveals the name and IP address of the hosts that are not responding in the cluster. |
The detailed diagnosis of Total physical hosts in cluster measure, if enabled, reveals the name and IP address of the physical hosts in the cluster.
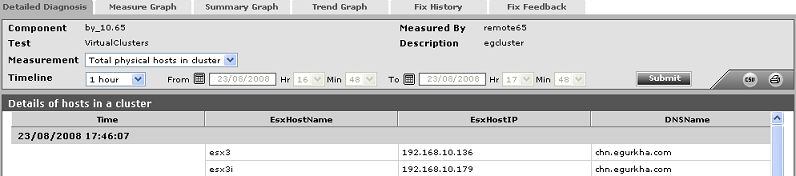
Figure 1 : The detailed diagnosis of the Total physical hosts in cluster measure
The detailed diagnosis of the VMs in cluster measure, if enabled, reveals the name of the VM, the ESX server on which the VM is executing, and and IP address of the ESX server.
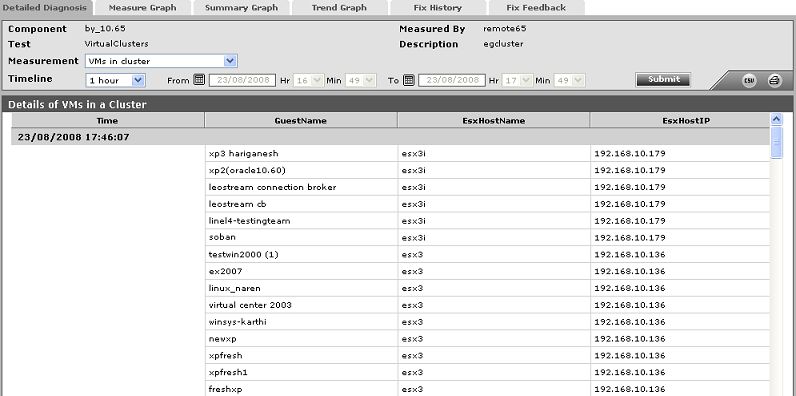
Figure 2 : The detailed diagnosis of the VMs in cluster measure
The detailed diagnosis the VMs powered on measure, if enabled, reveals the details of the powered-on VMs.
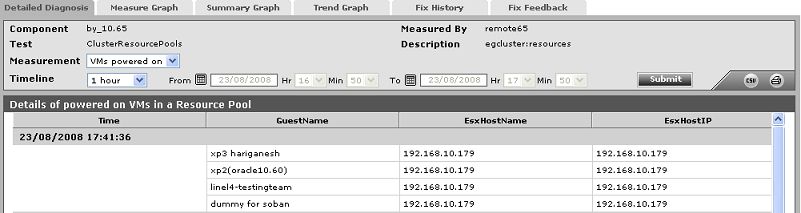
Figure 3 : The detailed diagnosis of the VMs powered on measure