vCenter Events Test
This test enables administrators to promptly capture and report the count and details of critical information, error, warning, and user events that are generated on the vCenter server.
By default, the test monitors a pre-defined set of events belonging to pre-configured event categories. You can override this default setting by including/excluding specific events from an event category. To achieve this, do the following:
- Login to the eG administrative interface.
- Follow the menu sequence: Agents -> Settings -> vCenter Events. Alternatively, you can also click on the Click here hyperlink that is available above the parameters of this test in the test configuration page.
-
Either way, VCENTER EVENTS page appears.
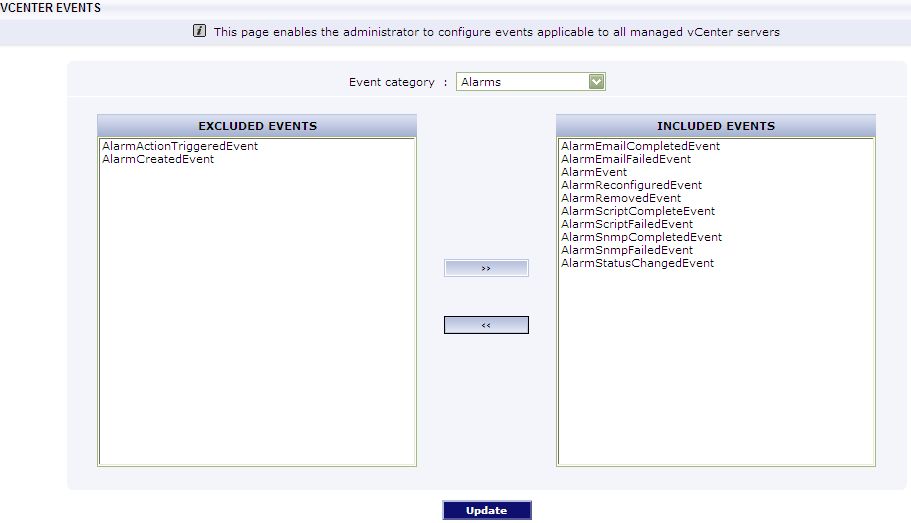
Figure 1 : Configuring the events to be monitored
-
Select an Event category to be monitored.
Note:
By default, the Event category list in VCENTER EVENTS page displays a pre-configured set of event categories. You can make more event categories available for selection in this list or remove one/more of the pre-defined categories, if need be. To achieve this, follow the steps given below:
- Edit the eg_tests.ini file in the <EG_INSTALL_DIRir>\manager\config directory.
-
In the [VirtualCenterEvents] section of this file, you will find the default event categories that will populate the Event category list and the individual events of each category. The format of these default entries is:
VCEventsTest:<EventCategory>=<Comma-separated list of events belonging to this category>
-
To add a new event category to this default list, you just need to append a line to the [VirtualCenterEvents] section in the format mentioned above. For instance, say, you want to include a category named NfcService to the Event category list. In this case, you will have to insert a line in the [VirtualCenterEvents] section for this category, as mentioned below:
VCEventsTest:NfcService=NfcService.randomAccessOpen,NfcService.randomAccessOpenReadonly,NfcService.getVmFiles,NfcService.putVmFiles,NfcService.fileManagement,NfcService.systemManagement
- Next, proceed to the [VCEventFilterTypes] section of the eg_tests.ini file. For every event category that is defined in the [VirtualCenterEvents] section, a corresponding entry should exist in the [VCEventFilterTypes] section. If not – i.e., if an event category exists only in the [VirtualCenterEvents] section and not in the [VCEventFilterTypes] section – then, such an event category will not be listed as an option in the ‘Event Category’ list box.
-
Typically, the [VCEventFilterTypes] section is used to indicate which events of a particular category need to be monitored by default, and which are not to be monitored. The entries to this section need to be of the following format:
VCEventsTest:<EventCategory>=<Comma-separated list of events to be included while monitoring>:<Comma-separated list of events to be excluded from monitoring>
To include/exclude all events of a particular category, use the keyword all, and to ensure that no events of a certain category is included/excluded, use the keyword none.
-
For instance, to ensure that all the events of the Alarms event category, except the alarm.Alarm.setCustomValue event, is to be monitored by default, your specification would be:
VCEventsTest:Alarms=all:alarm.Alarm.setCustomValue
- Once entries for the new event category are inserted in both the sections, save the eg_tests.ini file.
-
Selecting an Event category displays the tasks of the chosen category that are by default included for monitoring in the included events list, and those that are by default excluded from monitoring in the excluded events list.
Note:
Every event category that is defined in the [VirtualCenterEvents] section of the eg_tests.ini file (in the <EG_INSTALL_DIR>\manager\config directory) is associated with a set of events. Typically, to indicate which of these events need to be monitored by default, and which are not to be monitored, the [VCEventFilterTypes] section of the eg_tests.ini file is used.
For every event category defined in the [VirtualCenterEvents] section, a corresponding entry should exist in the [VCEventFilterTypes] section indicating the default set of events to be included and/or excluded from monitoring. This entry should be of the following format:
VCEventsTest:<EventCategory>=<Comma-separated list of events to be included while monitoring>:<Comma-separated list of events to be excluded from monitoring>
To include/exclude all events of a particular category, use the keyword all, and to ensure that no events of a certain category is included/excluded, use the keyword none.
For instance, to ensure that all the events of the Alarms event category, except the alarm.Alarm.setCustomValue event, is to be monitored by default, your specification would be:
VCEventsTest:Alarms=all:alarm.Alarm.setCustomValue
This makes sure that if the Alarms option is chosen from the Event category list, the excluded events list by default displays the event, alarm.Alarm.setCustomValue, and the included events list displays all other events associated with the Alarms category.
Note:
-
While using the [VCEventFilterTypes] section to configure specific events to be included/excluded by default for an event category, make sure that such events are a sub-set of the events that have been defined for that category in the [VirtualCenterEvents] section. For instance, say, you do not want to monitor the alarm.Alarm.setCustomValue event of the Alarms category. To ensure this, you will have to include the following line in the [VCEventFilterTypes] section:
VCEventsTest:Alarms=all:alarm.Alarm.setCustomValue
However, before adding this line to the [VCEventFilterTypes] section, verify whether the event, alarm.Alarm.setCustomValue,is available in the list of events that have been defined for the Alarms category in the [VirtualCenterEvents] section.
-
Make sure that entries such as the following are not inserted in the [vcEventFilterTypes] section:
VCEventsTest:<EventCategory>=all:all
VCEventsTest:<EventCategory>=none:none
Also, note that the keywords all and/or none should not be part of a comma-separated list.
-
- Finally, save the changes by clicking on the Update button.
This test is disabled by default. To enable the test, go to the enable / disable tests page using the menu sequence : Agents -> Tests -> Enable/Disable, pick the VMWare vCenter as the Component type, set Performance as the Test type, choose the test from the disabled tests list, and click on the < button to move the test to the ENABLED TESTS list. Finally, click the Update button.
Target of the test : A VMware vCenter server
Agent deploying the test : An internal agent
Outputs of the test : One set of results for every event category that has been configured for monitoring.
| Parameter | Description |
|---|---|
|
Test Period |
How often should the test be executed. |
|
Host |
The host for which this test is to be configured. |
|
Port |
Refers to the port at which the specified host listens to. |
|
VC User and VC Password |
To connect to vCenter and extract metrics from it, this test should be configured with the name and password of a user with Administrator or Virtual Machine Administrator privileges to vCenter. However, if, owing to security constraints, you are not able to use the credentials of such users for test configuration, then you can configure this test with the credentials of a user with Read-only rights to vCenter. For this purpose, you can assign the ‘Read-only’ role to a local/domain user to vCenter, and then specify name and password of this user against the VC User and VC Password text boxes. The steps for assigning this role to a user on vCenter have been detailed in vCenter servers terminate user sessions based on timeout periods. The default timeout period is 30 mins. When you stop an agent, sessions currently in use by the agent will remain open for this timeout period until vCenter times out the session. If the agent is restarted within the timeout period, it will open a new set of sessions. If you want the eG agent to close already existing sessions on vCenter before it opens new sessions, then, instead of the ‘Read-only’ user, you can optionally configure the VC User and VC Password parameters with the credentials of a user with permissions to View and Stop Sessions on vCenter. For this purpose, you can create a special role on vCenter, grant the View and Stop Sessions privilege (prior to vCenter 4.1, this was called the View and Terminate Sessions privilege) to this role, and then assign the new role to a local/domain user to vCenter. The steps for assigning this role to a user on vCenter have been detailed in |
|
Confirm Password |
Confirm the password by retyping it in this text box. |
|
SSL |
By default, the vCenter server is SSL-enabled. Accordingly, the SSL flag is set to Yes by default. This indicates that the eG agent will communicate with the vCenter server via HTTPS by default. |
|
Webport |
By default, in most virtualized environments, vCenter listens on port 80 (if not SSL-enabeld) or on port 443 (if SSL-enabled) only. This implies that while monitoring vCenter, the eG agent, by default, connects to port 80 or 443, depending upon the SSL-enabled status of vCenter – i.e., if vCenter is not SSL-enabled (i.e., if the SSL flag above is set to No), then the eG agent connects to vCenter using port 80 by default, and if vCenter is SSL-enabled (i.e., if the ssl flag is set to Yes), then the agent-vCenter communication occurs via port 443 by default. Accordingly, the Webport parameter is set to default by default. In some environments however, the default ports 80 or 443 might not apply. In such a case, against the Webport parameter, you can specify the exact port at which vCenter in your environment listens, so that the eG agent communicates with that port for collecting metrics from vCenter. |
|
Show Information DD |
Typically, if the Detailed Diagnosis flag is set to On for this test, then periodically, eG Enterprise collects the complete details of all the information, error, warning, and user events generated on vCenter, and stores them in the database. This way, whenever a user clicks on the Diagnosis icon (magnifying glass icon) corresponding to any of the measures reported by this test in the monitoring console, eG Enterprise retrieves the relevant detailed diagnosis information from the database and provides it to the user. In large virtualized environments however, the number of information events generated on the vCenter server will be quite huge. Naturally, the detailed diagnosis of such events will also occupy a considerable amount of database space, which will only grow with time. In order to minimize the strain on the eG database, by default, the detailed diagnosis capability for the information events alone is turned off in the eG Enterprise system. Accordingly, the Show Information DD flag is set to No by default. However, you can this flag is set to Yes, so that detailed diagnosis is available for information events as well. |
|
ShowAllOnly |
Set this flag to Yes, if you wish to view only the consolidated metrics of all the events of this test. This indicates that the All descriptor will alone be listed for this test. By default, this flag is set to No. |
|
ShowAllEvents |
By default, flag is set to Yes. This implies that the test, in addition to reporting metrics for configured event categories, will also report metrics for an All descriptor. Typically, the measures reported by the All descriptor will be the aggregate of the measures reported by all the other descriptors of this test - i.e., every measure reported by the All descriptor will actually return the sum of the values that all configured events have registered for that measure. This enables administrators to easily assess the overall performance of events configured for monitoring on a vCenter server. |
|
Exclude Hosts in Maintenance Mode |
By default, this flag is set to Yes indicating that this test will exclude the events from the hosts that are currently in maintenance mode. However, if you want this to report the events from the hosts in maintenance mode, set this flag to No. |
|
Event Types to Exclude |
Specify the event types you do not want this test to consider. This indicates that any events matching the specified types will be excluded by this test. By default, this is set to None indicating that this test will report all event types. |
|
Usernames to Exclude |
Enter the usernames whose events should be excluded by this test. This means that any events generated by the specified users will not be considered by this test. By default, this is set to None indicating that this test will included events from all users. |
|
DD Frequency |
Refers to the frequency with which detailed diagnosis measures are to be generated for this test. The default is 1:1. This indicates that, by default, detailed measures will be generated every time this test runs, and also every time the test detects a problem. You can modify this frequency, if you so desire. Also, if you intend to disable the detailed diagnosis capability for this test, you can do so by specifying none against DD Frequency. |
|
Detailed Diagnosis |
To make diagnosis more efficient and accurate, the eG Enterprise embeds an optional detailed diagnostic capability. With this capability, the eG agents can be configured to run detailed, more elaborate tests as and when specific problems are detected. To enable the detailed diagnosis capability of this test for a particular server, choose the On option. To disable the capability, click on the Off option. The option to selectively enable/disable the detailed diagnosis capability will be available only if the following conditions are fulfilled:
|
| Measurement | Description | Measurement Unit | Interpretation |
|---|---|---|---|
|
Information |
Indicates the number of information events of this category that occurred on vCenter in the last measurement period. For the All descriptor, this measure will report the sum of all information events that were captured on vCenter, across all event categories, in the last measurement period. |
Number |
A change in the value of this measure may indicate infrequent but successful operations performed by one or more events. Use the detailed diagnosis of this measure for more details on the information events.
|
|
Warnings |
Indicates the number of warning events of this category that occurred on vCenter in the last measurement period. For the All descriptor, this measure will report the sum of all warning events that were captured on vCenter, across all event categories, in the last measurement period. |
Number |
A high value of this measure indicates application problems that may not have an immediate impact, but may cause future problems in one or more events. Use the detailed diagnosis of this measure for more details on the warning events.
|
|
Errors |
Indicates the number of error events of this category that occurred on vCenter in the last measurement period. For the All descriptor, this measure will report the sum of all error events that were captured on vCenter, across all event categories, in the last measurement period. |
Number |
A value (zero) indicates that a vCenter is in a healthy state and is running smoothly without any potential problems. An increasing trend or high value indicates the existence of problems like loss of functionality or data in one or more events. Use the detailed diagnosis of this measure for more details on the error events.
|
|
User events |
Indicates the number of user events of this category that occurred on vCenter in the last measurement period. For the All descriptor, this measure will report the sum of all user events that were captured on vCenter, across all event categories, in the last measurement period. |
Number |
A change in the value of this measure may indicate infrequent but successful operations performed by one or more users. Use the detailed diagnosis of this measure for more details on the user events.
|
The detailed diagnosis of the Information measure reveals the description of each information event, the time at which it occurred, the user who initiated the event, and the exact location of the event in terms of the datacenter, cluster, EX host, and VM (if any) on which the event occurred.
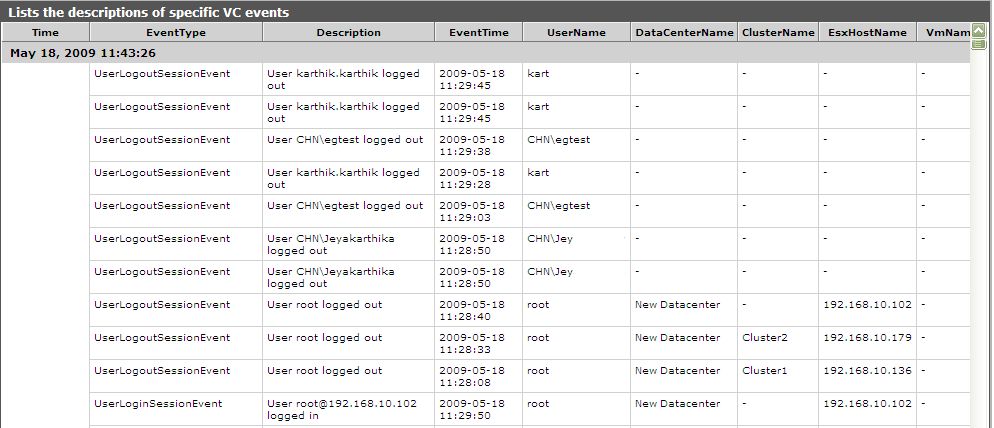
Figure 2 : The detailed diagnosis of the Information measure
The detailed diagnosis of the Information measure reveals the description of each error event, the time at which it occurred, the user who initiated the event, and the exact location of the event in terms of the datacenter, cluster, ESX host, and VM (if any) on which the event occurred.
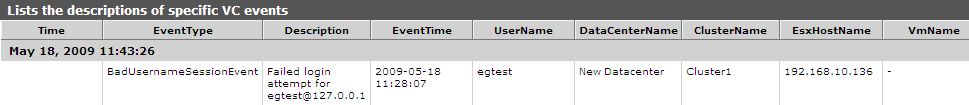
Figure 3 : The detailed diagnosis of the Error measure