4 vSAN Clusters Test
VMware vSAN is an enterprise storage virtualization software that supports hyper-converged infrastructure (HCI). vSAN is integrated into VMware hypervisor and ESXi host and enables administrators to pool and manage storage resources across ESXi hosts by creating a shared storage pool directly within the hypervisor layer. vSAN aggregates local and direct-attached data storage devices across a VMware vSphere cluster to create a single distributed data store that can be shared among all hosts in a vSAN cluster. In the VMware virtual environment, the vSAN cluster provide the distributed storage resources to vSAN clients typically VMs running on the ESXi hosts for their virtual disk needs. The vSAN clients interact with the vSAN clusters through vSAN datastore and sends read/write operation requests that are then processed by the vSAN backend of the vSAN cluster. The vSAN backend handles the data distribution, replication, compression and deduplication and generates resync traffic to restore data redundancy when a failure occurs or objects are redistributed.
If a vSAN cluster that provides storage resources to the vSAN clients suffers due to excessive space utilization, congestion, many pending IO requests and significant delays in read/write IO operations during resynchronization process, then the vSAN cluster will not be able provide the distributed storage resources to the clients. This will create performance bottlenecks on the vSAN cluster and seriously impact the operations of the vSAN clients. To avoid such inconveniences, administrators should continuously monitor the vSAN clusters in the VMware environment. This can be easily achieved using the vSAN Clusters test.
This test auto-discovers the vSAN clusters in the target VMware environment and for each vSAN cluster, reports the current status and the count of hosts that contribute the storage resources to the vSAn datastore. In addition, this tests reports the disk utilization on each cluster which enables the administrators to quickly find out excessive disk utilization. This test also reports the storage space saved through deduplication and compression processes on each cluster and reveals the amount of disk space utilized from the reserved capacity. Furthermore, the number of times that each cluster is overloaded and the count of requests that are waiting to be processed are reported by this test. This helps administrators to easily figure out potential overload bottlenecks on each cluster. This test also reveals the read/write IOPS, throughput, and latency levels of each cluster, thus enabling administrators to take necessary actions to prevent potential issues that may be caused due to slowness, lower throughput rates and higher latencies and address the issues before they escalate into serious problems.
Target of the test : A VMware vCenter server
Agent deploying the test : An internal agent
Outputs of the test : One set of results for each vSAN cluster managed by VMware vCenter
| Parameter | Description |
|---|---|
|
Test Period |
How often should the test be executed. |
|
Host |
The host for which this test is to be configured. |
|
Port |
Refers to the port at which the specified host listens to. |
|
VC User and VC Password |
To connect to vCenter and extract metrics from it, this test should be configured with the name and password of a user with Administrator or Virtual Machine Administrator privileges to vCenter. However, if, owing to security constraints, you are not able to use the credentials of such users for test configuration, then you can configure this test with the credentials of a user with Read-only rights to vCenter. For this purpose, you can assign the ‘Read-only’ role to a local/domain user to vCenter, and then specify name and password of this user against the VC User and VC Password text boxes. The steps for assigning this role to a user on vCenter have been detailed in vCenter servers terminate user sessions based on timeout periods. The default timeout period is 30 mins. When you stop an agent, sessions currently in use by the agent will remain open for this timeout period until vCenter times out the session. If the agent is restarted within the timeout period, it will open a new set of sessions. If you want the eG agent to close already existing sessions on vCenter before it opens new sessions, then, instead of the ‘Read-only’ user, you can optionally configure the VC User and VC Password parameters with the credentials of a user with permissions to View and Stop Sessions on vCenter. For this purpose, you can create a special role on vCenter, grant the View and Stop Sessions privilege (prior to vCenter 4.1, this was called the View and Terminate Sessions privilege) to this role, and then assign the new role to a local/domain user to vCenter. The steps for assigning this role to a user on vCenter have been detailed in |
|
Confirm Password |
Confirm the password by retyping it in this text box. |
|
SSL |
By default, the vCenter server is SSL-enabled. Accordingly, the SSL flag is set to Yes by default. This indicates that the eG agent will communicate with the vCenter server via HTTPS by default. |
|
Webport |
By default, in most virtualized environments, vCenter listens on port 80 (if not SSL-enabeld) or on port 443 (if SSL-enabled) only. This implies that while monitoring vCenter, the eG agent, by default, connects to port 80 or 443, depending upon the SSL-enabled status of vCenter – i.e., if vCenter is not SSL-enabled (i.e., if the SSL flag above is set to No), then the eG agent connects to vCenter using port 80 by default, and if vCenter is SSL-enabled (i.e., if the ssl flag is set to Yes), then the agent-vCenter communication occurs via port 443 by default. Accordingly, the Webport parameter is set to default by default. In some environments however, the default ports 80 or 443 might not apply. In such a case, against the Webport parameter, you can specify the exact port at which vCenter in your environment listens, so that the eG agent communicates with that port for collecting metrics from vCenter. |
|
DD Frequency |
Refers to the frequency with which detailed diagnosis measures are to be generated for this test. The default is 1:1. This indicates that, by default, detailed measures will be generated every time this test runs, and also every time the test detects a problem. You can modify this frequency, if you so desire. Also, if you intend to disable the detailed diagnosis capability for this test, you can do so by specifying none against DD frequency. |
|
Detailed Diagnosis |
To make diagnosis more efficient and accurate, the eG Enterprise embeds an optional detailed diagnostic capability. With this capability, the eG agents can be configured to run detailed, more elaborate tests as and when specific problems are detected. To enable the detailed diagnosis capability of this test for a particular server, choose the On option. To disable the capability, click on the Off option. The option to selectively enable/disable the detailed diagnosis capability will be available only if the following conditions are fulfilled:
|
|
Measurement |
Description |
Measurement Unit |
Interpretation |
||||||||
|---|---|---|---|---|---|---|---|---|---|---|---|
|
Total disk space |
Indicates the total disk space allocated for this vSAN cluster. |
GB |
|
||||||||
|
Disk space used |
Indicates the amount of physical disk space used on this vSAN cluster. |
GB |
The value of this measure should be low. |
||||||||
|
Disk space free |
Indicates the amount of physical disk space available for use on this vSAN cluster. |
GB |
A high value is desired for this measure. |
||||||||
|
Deduplication and Compression |
Indicates the amount of disk space that is deduplicated and compressed on this cluster. |
GB |
A high value is preferred for this measure. In vSAN Original Storage Architecture, deduplication and compression are enabled as a cluster-wide setting. When you enable deduplication and compression on a vSAN all-flash cluster, redundant data within each disk group or storage pool is reduced. Deduplication removes redundant data blocks, whereas compression removes additional redundant data within each data block. These techniques work together to reduce the amount of space required to store the data. vSAN applies deduplication and then compression as it moves data from the cache tier to the capacity tier. |
||||||||
|
Actually written |
Indicates the amount of physical disk capacity that is actually used on the disk after deduplication, compression, and RAID configurations are applied. |
GB |
This measure denotes the real physical storage capacity utilized on the disks, which can be lower than the logical or used capacity due to space-saving efficiencies. |
||||||||
|
Dedup & compression savings |
Indicates the amount of disk space saved on this vSAN cluster through deduplication and compression. |
GB |
Ideally, the value of this measure should be high. |
||||||||
|
Dedup & compression savings ratio |
Indicates the ratio between the logical space required to store data before applying deduplication and compression, and the physical space required after applying deduplication and compression. |
Number |
The value of this measure is calculated based on the following formula: Savings ratio = Logical space used before deduplication and compression / Physical space required after applying deduplication and compression For example, if the logical space used before deduplication and compression is 10 GB, but the physical space used after deduplication and compression is 5 GB, the deduplication and compression ratio is calculated as follows: Savings ratio = 10 GB/5 GB = 2 Here, the ratio value indicates that for every 10 GB of data written, only 5 GB of actual storage is used, effectively saving 50% of storage space. |
||||||||
|
Disk space utilization |
Indicates the percentage of disk space utilized on this vSAN cluster. |
Percent |
Ideally, the value of this measure should be low. A value close to 100 is a cause for concern. |
||||||||
|
vSAN system overhead |
Indicates the amount of physical storage space that has been reserved for future use on this vSAN cluster. |
GB |
VMware vSAN reserves a certain amount of storage space to manage and maintain the integrity, performance, and resilience of the cluster. This reserved capacity is necessary for the proper functioning of vSAN and is automatically managed by the vSAN system. This helps administrators in planning capacity for future usage and optimizing storage resources in a vSAN environment. |
||||||||
|
Used - Physically written |
Indicates the amount of physical storage space used on this vSAN cluster. |
GB |
A low value is preferred for this measure. |
||||||||
|
Used - VM over-reserved |
Indicates the amount of storage space used from the extra storage capacity that the virtual machines have claimed or reserved than they actively require. |
GB |
|
||||||||
|
Disk space allocated to VMs |
Indicates the total amount of storage space allocated assigned to the virtual machines in this cluster. |
GB |
|
||||||||
|
Status |
Indicates the current status of this cluster. |
|
The values that this measure can report and its corresponding numeric equivalents are listed in the table below:
Note: By default, this measure reports the Measure Values listed in the table above to indicate the current status of each cluster. In the graph of this measure however, the same is represented using the corresponding numeric equivalents only. |
||||||||
|
Hosts |
Indicates the number of hosts that contribute storage to this vSAN cluster. |
Number |
A single vSAN cluster consists of a minimum of three hosts. The count of hosts varies based on the deployment option chosen. The deployment options are:
The detailed diagnosis of this measure list the name of the hosts that are sharing their storage to the cluster. It also reveals whether the host is a master host or not. |
||||||||
|
Read IOPS by vSAN clients |
Indicates the number of read operations performed per second by vSAN clients connected to this cluster. |
Operations/second |
|
||||||||
|
Write IOPS by vSAN clients |
Indicates the number of write operations performed per second by vSAN clients connected to this cluster. |
Operations/second |
|
||||||||
|
Read throughput by vSAN clients |
Indicates the rate at which data is read by the vSAN clients from this vSAN cluster. |
MB/sec |
Ideally, the value of this measure should be high. A low value for this measure indicates increase in latency during read operations. |
||||||||
|
Write throughput by vSAN clients |
Indicates the rate at which data is written by the vSAN clients on this vSAN cluster. |
MB/sec |
Ideally, the value of this measure should be high. A low value for this measure indicates increase in latency during write operations. |
||||||||
|
Read latency by vSAN clients |
Indicates the time taken by this cluster to process the read requests from the vSAN clients. |
Seconds |
Ideally, the values of these measures should be very low. Compare the values of these measures across the clusters to figure out where the slowness is maximum - when processing read requests? or write requests? |
||||||||
|
Write latency by vSAN clients |
Indicates the time taken by this cluster to process the write requests from the vSAN clients. |
Seconds |
|||||||||
|
Congestions by vSAN clients |
Indicates the number of times that this vSAN cluster was overloaded by the vSAN clients during the last measurement period. |
Number |
A high value for this measure indicates increased I/O latency, reduced throughput, and overall slower performance for VMs relying on the vSAN cluster. |
||||||||
|
Outstanding IO by vSAN clients |
Indicates the number of I/O requests issued by vSAN clients that are currently waiting to be processed. |
Number |
A low value is preferred for this measure. This measure sheds light on how well the vSAN cluster is handling the workload. |
||||||||
|
Read IOPS for the vSAN backend |
Indicates the rate at which the read IO operations are performed by this cluster while processing and retrieving data from the vSAN backend. |
Reads/second |
In a VMware vSAN (Virtual SAN) environment, the backend refers to the underlying storage infrastructure that supports the virtual SAN's operation. It’s the part of the vSAN system responsible for physically storing data and handling I/O operations on behalf of the virtual machines (VMs). The backend includes the storage devices (such as SSDs, HDDs, and NVMe) used to persist data and the network resources connecting the various hosts in the vSAN cluster. |
||||||||
|
Read IOPS of resync traffic |
Indicates the number of read IO operations are performed per second during the data resynchronization process. |
Reads/second |
|
||||||||
|
Write IOPS for the vSAN backend |
Indicates the rate at which the write IO operations are performed by this cluster while processing and retrieving data from the vSAN backend. |
Writes/second |
|
||||||||
|
Recovery write IOPS for the vSAN backend |
Indicates the number of write IO operations performed by this cluster per second during the data recovery process. |
Writes/second |
|
||||||||
|
Read throughput for the vSAN backend |
Indicates the rate at which the data is read from the vSAN backend of this cluster. |
MB/sec |
|
||||||||
|
Read throughput of resync traffic |
Indicates the rate at which the data is read from the vSAN backend during a resynchronization process. |
MB/sec |
|
||||||||
|
Write throughput for the vSAN backend |
Indicates the rate at which the data is written on the vSAN backend. |
MB/sec |
|
||||||||
|
Recovery write throughput for the vSAN backend |
Indicates the rate at which the data is written to the backend storage in this cluster during a recovery operation. |
MB/sec |
|
||||||||
|
Read latency for the vSAN backend |
Indicates the time taken to read data from the vSAN backend in this vSAN cluster. |
Seconds |
The value of this measure should be low. |
||||||||
|
Read Latency of resync traffic |
Indicates the time taken to perform read operations on the vSAN backend during the resynchronization process. |
Seconds |
The value of this measure should be low. |
||||||||
|
Write latency for the vSAN backend |
Indicates the time taken to write data on the vSAN backend in this vSAN cluster. |
Seconds |
The value of this measure should be low. |
||||||||
|
Recovery write latency for the vSAN backend |
Indicates the time taken to perform write operations on the vSAN backend in this vSAN cluster during the recovery process. |
Seconds |
The value of this measure should be low. |
||||||||
|
Congestions for the vSAN backend |
Indicates the number of times that the vSAN backend in this vSAN cluster was overloaded during the last measurement period. |
Number |
The value of this measure should be low. |
||||||||
|
Outstanding IO for the vSAN backend |
Indicates the number of I/O requests issued by vSAN backend that are currently waiting to be processed. |
Number |
A low value is preferred for this measure. |
The detailed diagnosis of Hosts measure reveals the name of the physical hosts that contribute the storage to the vSAN cluster. In addition, it also reveals whether the host is a master host or not.
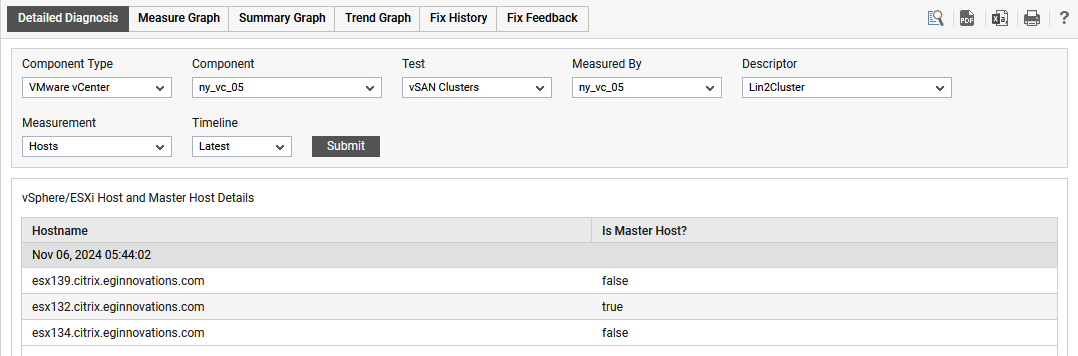
Figure 1 : The detailed diagnosis of the Hosts measure