vSAN Host Health Status Test
Virtual SAN is a radically simple, hypervisor-converged storage solution for virtual machines. It delivers high performance, scale-out storage that is optimized for vSphere virtual infrastructure. It is an enterprise-class storage solution for any virtualized application, including business-critical workloads. Its seamless integration with vSphere and the entire VMware stack makes it the ideal storage platform for virtual machines. Virtual SAN 6.0 can be configured as hybrid or all-flash storage. In a hybrid storage architecture, Virtual SAN pools server-attached capacity devices, in this case magnetic devices, and caching devices, typically SSDs, and PCI-e devices to create a distributed shared datastore that abstracts the storage hardware and provides a Software-Defined Storage tier for virtual machines.
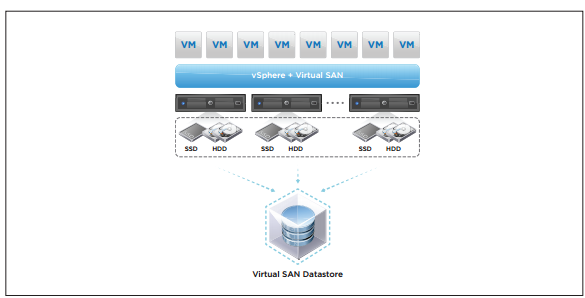
Figure 1 : VMware virtual SAN
If a host that participates in the vSAN service fails or suffers hardware issues, the vSAN itself may be rendered unavailable/unusable, thus impacting the performance of all the VMs that are using that vSAN. It is hence imperative that administrators monitor the health of every host that contributes its storage resources to the vSAN, quickly identify the host that is experiencing errors/failures, and take pre-emptive measures to fix the faults, so that VM performance is not impacted. This is where the vSAN Host Health Status test helps. This test alerts administrators to the unhealthy state of any host that is participating in the vSAN service, and ensures their timely intervention in resolving the issues and restoring normalcy.
Target of the test : A VMware vCenter server
Agent deploying the test : An internal agent
Outputs of the test : One set of results for every vSphere/ESX server host that is participating in the vSAN service.
| Parameter | Description |
|---|---|
|
Test Period |
How often should the test be executed. |
|
Host |
The host for which this test is to be configured. |
|
Port |
Refers to the port at which the specified host listens to. |
|
VC User and VC Password |
To connect to vCenter and extract metrics from it, this test should be configured with the name and password of a user with Administrator or Virtual Machine Administrator privileges to vCenter. However, if, owing to security constraints, you are not able to use the credentials of such users for test configuration, then you can configure this test with the credentials of a user with Read-only rights to vCenter. For this purpose, you can assign the ‘Read-only’ role to a local/domain user to vCenter, and then specify name and password of this user against the VC User and VC Password text boxes. The steps for assigning this role to a user on vCenter have been detailed in vCenter servers terminate user sessions based on timeout periods. The default timeout period is 30 mins. When you stop an agent, sessions currently in use by the agent will remain open for this timeout period until vCenter times out the session. If the agent is restarted within the timeout period, it will open a new set of sessions. If you want the eG agent to close already existing sessions on vCenter before it opens new sessions, then, instead of the ‘Read-only’ user, you can optionally configure the VC User and VC Password parameters with the credentials of a user with permissions to View and Stop Sessions on vCenter. For this purpose, you can create a special role on vCenter, grant the View and Stop Sessions privilege (prior to vCenter 4.1, this was called the View and Terminate Sessions privilege) to this role, and then assign the new role to a local/domain user to vCenter. The steps for assigning this role to a user on vCenter have been detailed in |
|
Confirm Password |
Confirm the password by retyping it in this text box. |
|
SSL |
By default, the vCenter server is SSL-enabled. Accordingly, the SSL flag is set to Yes by default. This indicates that the eG agent will communicate with the vCenter server via HTTPS by default. |
|
Webport |
By default, in most virtualized environments, vCenter listens on port 80 (if not SSL-enabeld) or on port 443 (if SSL-enabled) only. This implies that while monitoring vCenter, the eG agent, by default, connects to port 80 or 443, depending upon the SSL-enabled status of vCenter – i.e., if vCenter is not SSL-enabled (i.e., if the SSL flag above is set to No), then the eG agent connects to vCenter using port 80 by default, and if vCenter is SSL-enabled (i.e., if the ssl flag is set to Yes), then the agent-vCenter communication occurs via port 443 by default. Accordingly, the Webport parameter is set to default by default. In some environments however, the default ports 80 or 443 might not apply. In such a case, against the Webport parameter, you can specify the exact port at which vCenter in your environment listens, so that the eG agent communicates with that port for collecting metrics from vCenter. |
| Measurement | Description | Measurement Unit | Interpretation | ||||||
|---|---|---|---|---|---|---|---|---|---|
|
Health status |
Indicates whether/not this host is in a healthy state currently. |
|
The values that this measure reports and their corresponding numeric values are listed below:
Note: By default, this measure reports the Measure Values listed in the table above. In the graph of this measure however, the state of the host is represented using the corresponding numeric equivalents only. |