Simulated Web Transactions Test
This test emulates a user logging into a web application being monitored by the Web App Simulator tool. In the process, the test reports the availability and responsiveness of the web application. The activities that were successful and that failed are measured and reported along with the total simulation time. Additionally, the test also captures failures (if any) at each step of the simulation. Using the insights provided by this test, administrators can proactively detect logon slowness/failures and precisely pinpoint the root-cause of the anomaly. This way, web administrators are enabled to isolate the probable pain-points of their web application, even before users begin to actively use the web application.
Target of the test : A web site or a web application
Agent deploying the test : An external agent
Outputs of the test : One set of results for every transaction in each recorded script
|
Parameters |
Description |
|---|---|
|
Test period |
How often should the test be executed. The default is 15 minutes. |
|
Host |
The host for which the test is to be configured |
|
Port |
Refers to the port used by the target web application |
|
Script Name |
By default, the scripts that are available for simulation will be listed in this list box. You can select one/more scripts from this list for monitoring. eG Enterprise is also capable of monitoring the scripts that are recorded and exported by more than one user using a single component. For this purpose, a separate
Figure 1 : Choosing the Script file In Figure 1, select the user who has recorded one/more scripts to be monitored from the User Name list. The scripts corresponding to that user will be populated in the Script File list box. Select the script and click the Submit button. You are allowed to choose more than one User Name:Script File combination. |
|
Console Username |
The simulator needs to run in the account of a user who has local administrator rights on the simulation end point - i.e., the system on which the external agent is installed. Specify the name of this user here. This user should also be logged in at all times for the simulator to run continuously. |
|
Console Domain |
Specify the domain to which the Console Username belongs to. By default, none is specified against this parameter. |
|
Success Screenshot Required |
By default, this flag is set to No indicating that the web app simulator will not capture a screenshot and display the same against the Transaction availability measure of the Total descriptor in the layer model , if the simulation performed was successful. If you wish to capture a screenshot for successful simulations and display the same, then, set this flag to Yes. |
|
Enable Session Active |
For the Web App simulation to be successful on the simulation endpoint at all times, it is important for the Windows user session to always remain 'active'. To this effect, this flag is set to Yes by default. |
|
Pause Test |
By default, this flag is set to No indicating that administrators had to reconfigure this test whenever they performed troubleshooting of the site or the machine on which the Web App simulation agent was installed. By setting this flag to Yes, they can simply pause the test and continue troubleshooting. The test configuration will be retained until the execution of the test is resumed. |
|
No of Retries |
Sometimes, the transactions may fail to be simulated once in a while due to network issues, system updates, etc. This can result in false alerts. To avoid such false alerts, the Web App simulator supports retries. By configuring 1 or more retries against this parameter, you can considerably reduce false alerts. By default, this is set to 0. For example, if you set this parameter to 2, then, if the first simulation attempt is successful, then, the Web App simulator completes the simulation and reports the metrics. However, if the first simulation fails, then, the Web App simulator attempts the simulation again. Alerts will be raised only when the simulation fails in all the retries. |
|
DD Frequency |
Refers to the frequency with which detailed diagnosis measures are to be generated for this test. The default is 1:1. This indicates that, by default, detailed measures will be generated every time this test runs, and also every time the test detects a problem. You can modify this frequency, if you so desire. Also, if you intend to disable the detailed diagnosis capability for this test, you can do so by specifying none against DD frequency. |
|
Detailed Diagnosis |
To make diagnosis more efficient and accurate, the eG Enterprise embeds an optional detailed diagnostic capability. With this capability, the eG agents can be configured to run detailed, more elaborate tests as and when specific problems are detected. To enable the detailed diagnosis capability of this test for a particular server, choose the On option. To disable the capability, click on the Off option. The option to selectively enable/disable the detailed diagnosis capability will be available only if the following conditions are fulfilled:
|
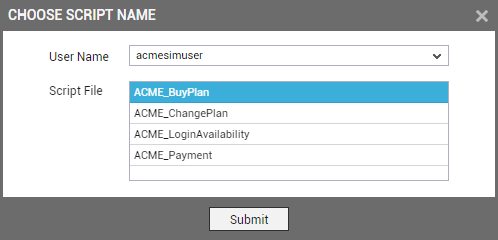
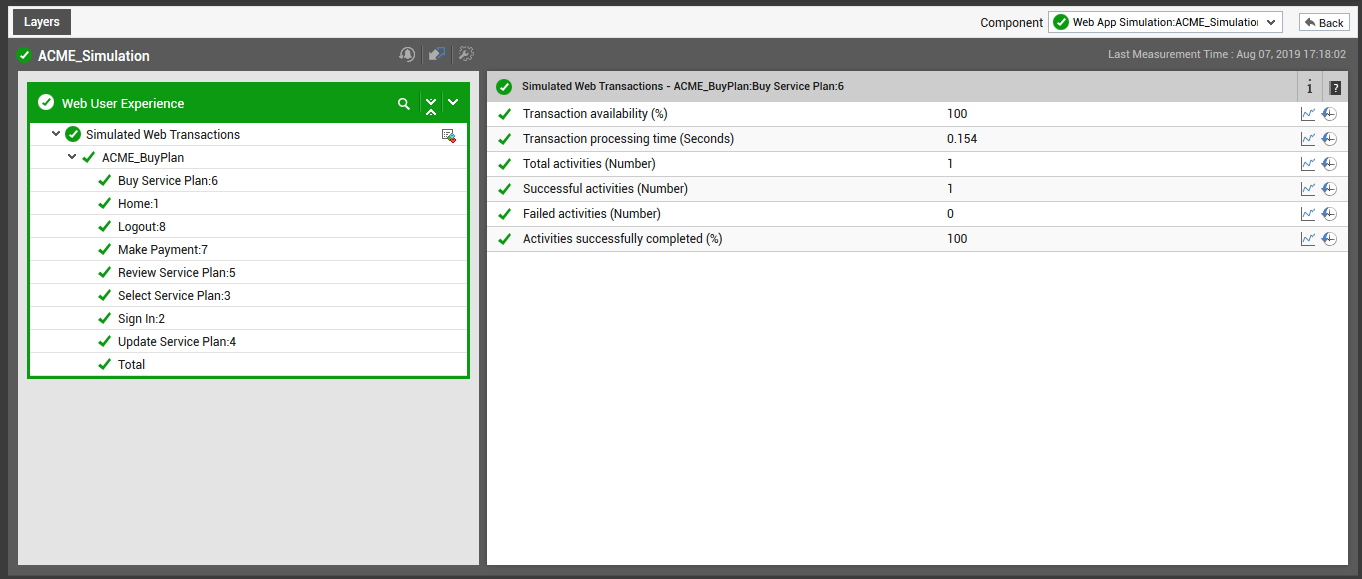
Figure 2 : The measures reported by the Simulated Web Transactions test
| Measurement | Description | Measurement Unit | Interpretation | ||||||
|---|---|---|---|---|---|---|---|---|---|
|
Transaction availability |
Indicates whether/not this transaction is completed successfully. |
Percent |
The value 100 for this measure indicates that the transaction was completed successfully, and the value 0 indicates that transaction failed. If this measure reports the value 0, then no other measures will be reported for that transaction. You can also use the detailed diagnosis of this measure to view |
||||||
|
Transaction processing time |
Indicates the time taken by this transaction for execution. |
Secs |
Compare the value of this measure across the transactions to figure out the transaction that is taking too much time for execution. |
||||||
|
Total activities |
Indicates the total number of activities performed by this transaction. |
Number |
|
||||||
|
Successful activities |
Indicates the number of activities that were successfully performed by this transaction. |
Number |
Compare the value of this measure across transactions to figure out the transaction for which least number of activities were successful. |
||||||
|
Failed activities |
Indicates the number of activities that failed for this transaction. |
Number |
Compare the value of this measure across transactions to figure out the transaction for which the maximum number of activities failed. |
||||||
|
Activities successfully completed |
Indicates the percentage of activities successfully completed for this transaction. |
Percent |
The value 100 for this measure indicates that the activities were successfully completed, and the value 0 indicates that the activities failed to complete. By comparing the value of this measure across transactions, you can quickly identify the transactions for which the activities failed to complete successfully. |
||||||
|
Total simulation time |
Indicates the total time taken to simulate this transaction. |
Secs |
This measure is applicable only for the Total descriptor. An abnormally high value for this measure could indicate a logon slowness. |
||||||
|
Is Script running |
Indicates whether/not this script specified against the Script Name parameter (in the test configuration) is running. |
|
This measure is applicable only for the Total descriptor. The values reported by this measure and its numeric equivalents are mentioned in the table below:
Note: By default, this measure reports the Measure Values listed in the table above to indicate whether/not the script is running. The graph of this measure however, is represented using the numeric equivalents only i.e., 0 or 1. You can also use the detailed diagnosis of this measure to identify the failure and problem points experienced by the script at first glance. |
||||||
|
Number of simulation retries |
Indicates the number of times the simulation was retried to simulate this transaction. |
Number |
Alerts are raised if the value of this measure is greater than 0. |
The detailed diagnosis of the Transaction availability measure will appear only when a value of 0 is reported. Clicking the ![]() icon will lead you to the screenshot which visually indicates the exact transaction at which the script failed during simulation. Clicking the
icon will lead you to the screenshot which visually indicates the exact transaction at which the script failed during simulation. Clicking the ![]() icon will directly open the screenshot that was captured when the transaction failed.
icon will directly open the screenshot that was captured when the transaction failed.
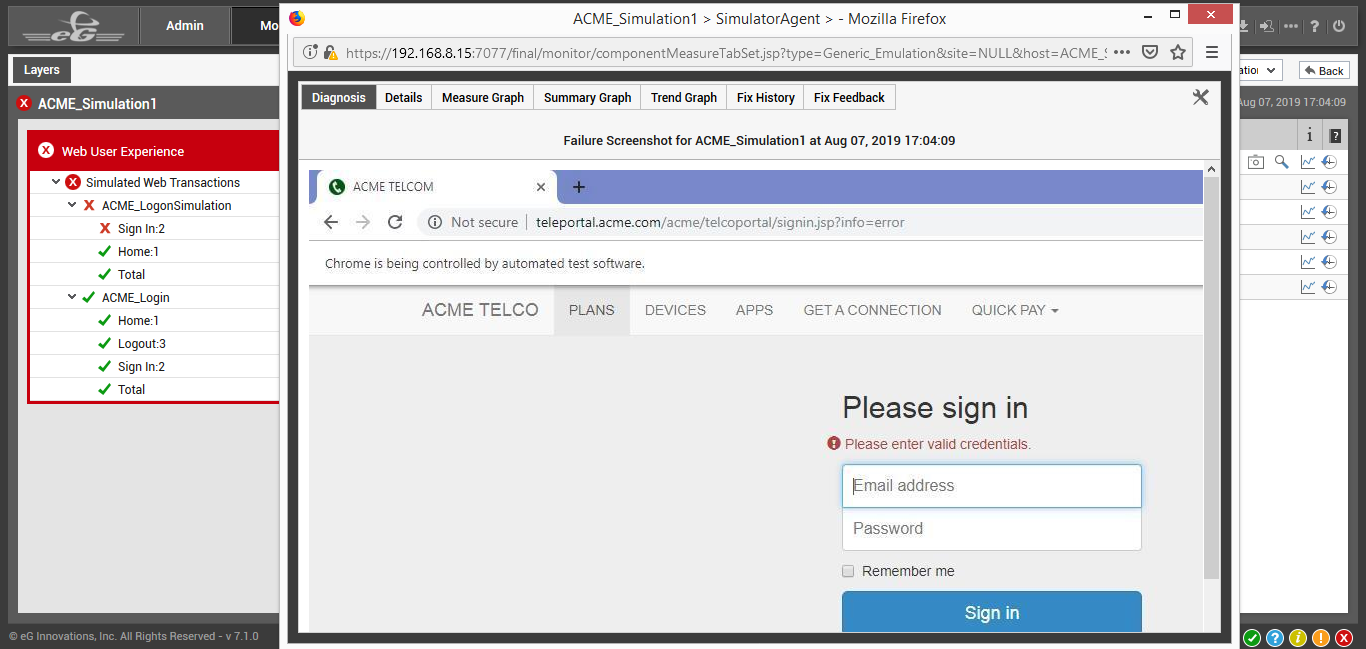
Figure 3 : The Failure screenshot that was captured
Use the Details section of the detailed diagnosis to view the transaction flow, output of the simulation script, scrutinize it, and isolate the failure and problem points of the web application at first look. A summary of the simulation is also provided as part of the detailed diagnostics.
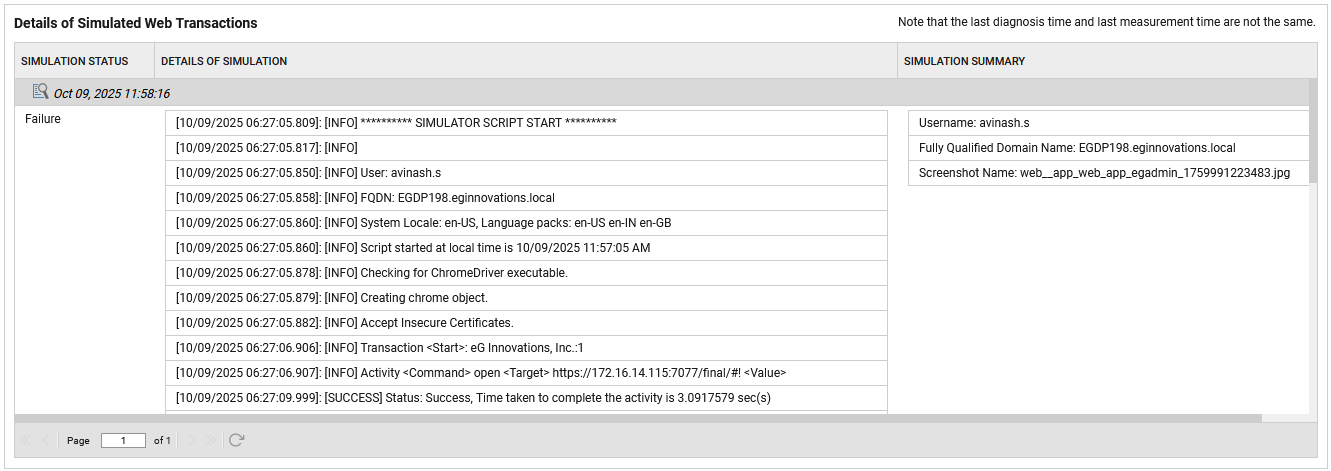
Figure 4 : The detailed diagnosis of the Transaction availability measure