Synthetic Monitoring Dashboard
Where two/more Web App Simulation components are managed, clicking on the Web App Simulation component-type in the Components At-A-Glance section of the Monitor dashboard automatically opens the Synthetic Monitoring Dashboard.
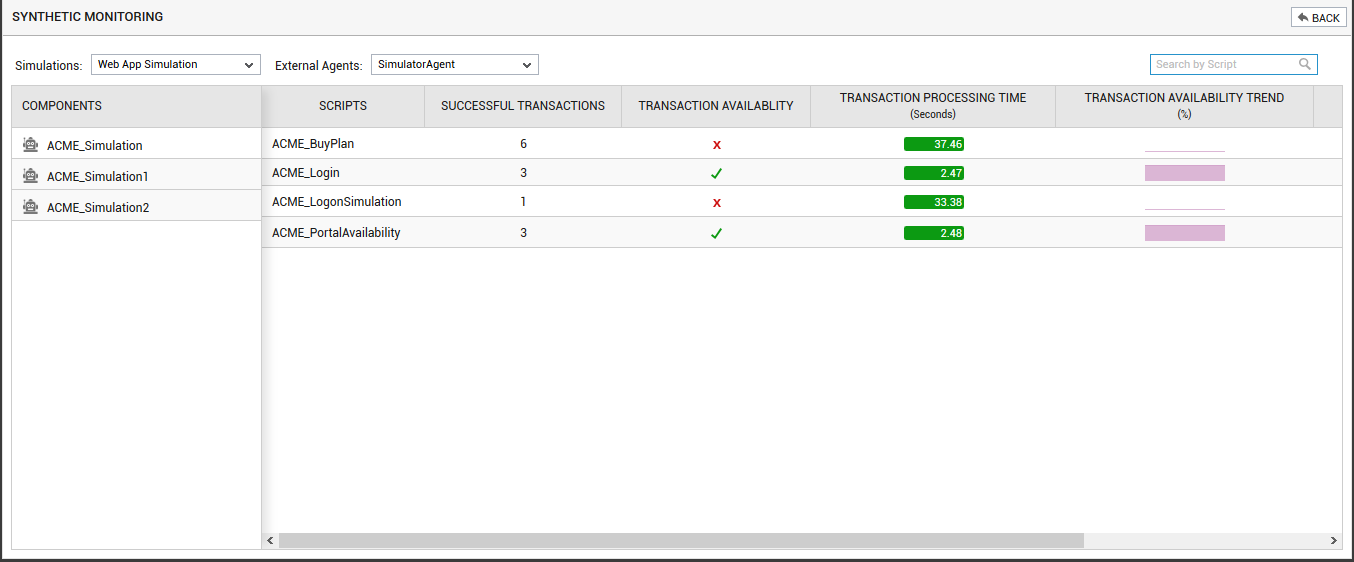
Figure 1 : The Synthetic Monitoring Dashboard
By default, the dashboard displays all the simulations performed by all the simulators configured in an environment. For each simulation, the dashboard displays the transactions that were successfully simulated, the availability of the transaction, the processing time of the transaction, the transaction availability trend and the processing time trend of each transaction as captured by that simulation. This way, the simulations that failed and the precise failure points (for e.g., availability) of each simulation can be instantly and accurately isolated. Clicking on a simulation in Figure 1 will lead you to the transaction flow process as shown in Figure 2. Using this graphical representation, administrators can clearly identify the step of the simulation process has failed completely.
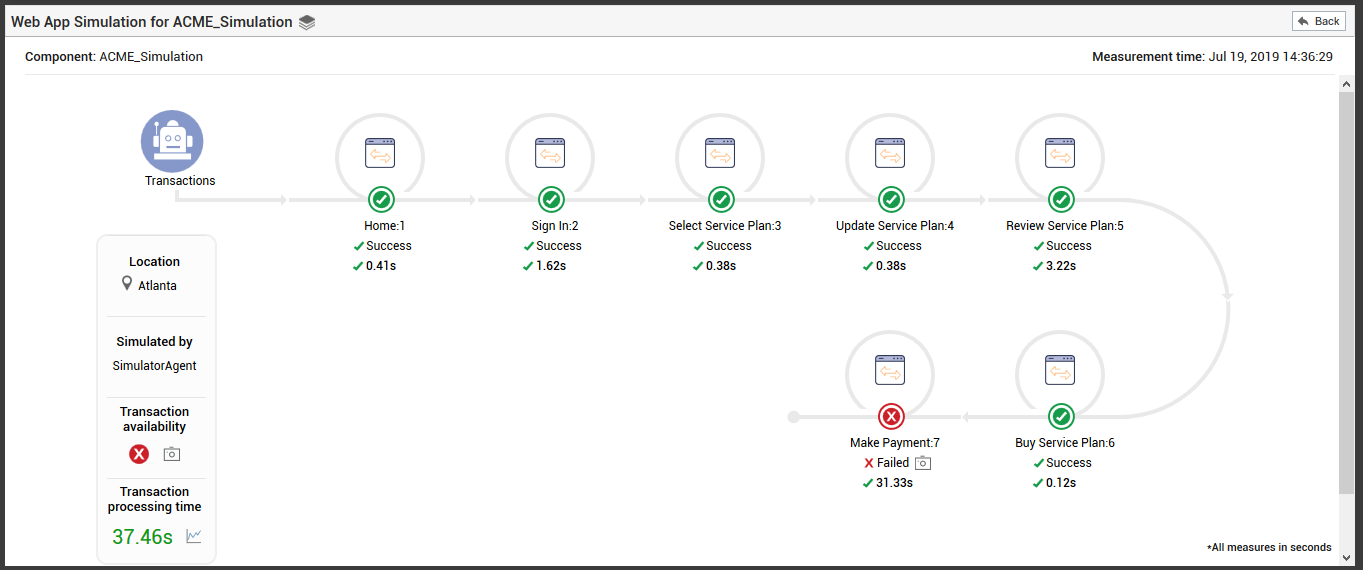
Figure 2 : A graphical view of the transaction
You can click on the ![]() icon if failures were detected. This will lead you to the screenshot of the page on which the transaction failed (see Figure 3).
icon if failures were detected. This will lead you to the screenshot of the page on which the transaction failed (see Figure 3).
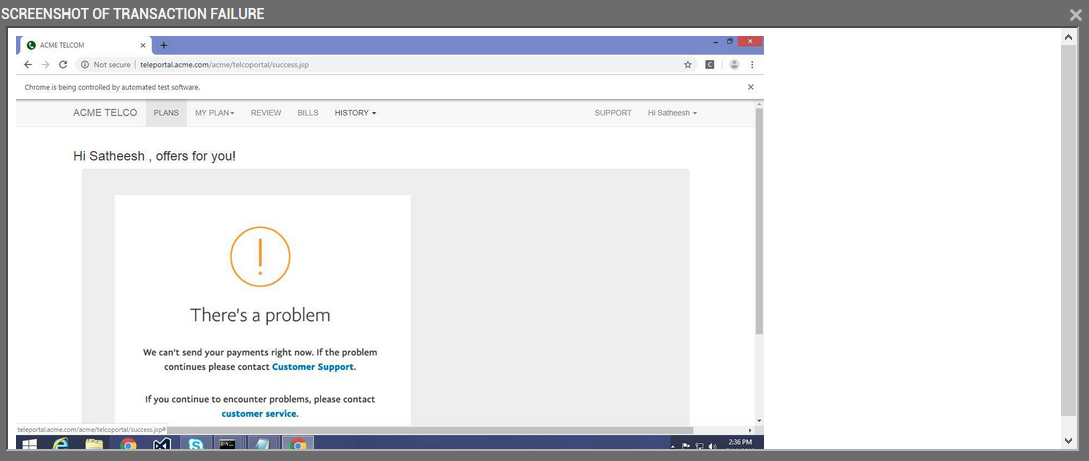
Figure 3 : The simulation script highlighting the success and failure points of the simulation
Similarly, to view the performance trend of the simulated transaction over a period of time, you can click the ![]() icon against the Transaction processing time measure (see Figure 2). This will lead you to Figure 4.
icon against the Transaction processing time measure (see Figure 2). This will lead you to Figure 4.
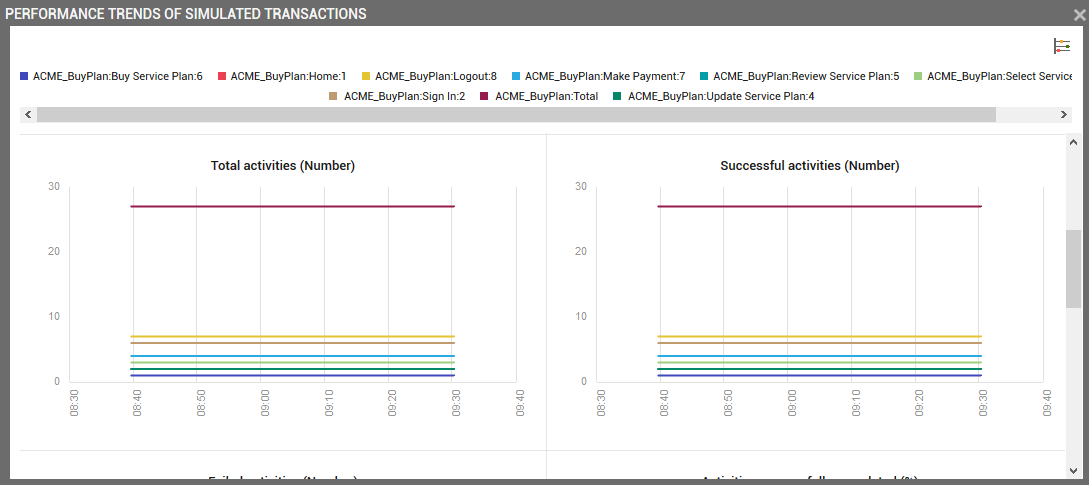
Figure 4 : Analyzing the performance trend of the simulated transaction
By default, the performance trend of each measure of the simulated transaction is analyzed and graphs are plotted individually. The default, time duration for plotting the graph is 1 hour. Using the graphs that are plotted, administrators can determine how well the simulated transaction has performed in the last 1 hour. If you wish to change time period to analyze the performance trend, then, you can click the ![]() icon. Figure 5 will then appear using which you can change the Timeline for which the graphs need to be plotted.
icon. Figure 5 will then appear using which you can change the Timeline for which the graphs need to be plotted.
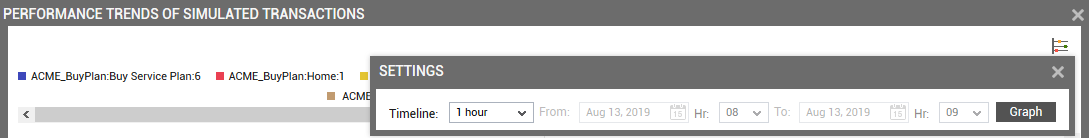
Figure 5 : Changing the time period for analyzing the simulated transaction graphs
You can even choose an image for each transaction activity that is recorded in the transaction flow process. For this purpose, click on any activity icon that you wish to change in Figure 2. Figure 6 will then appear.
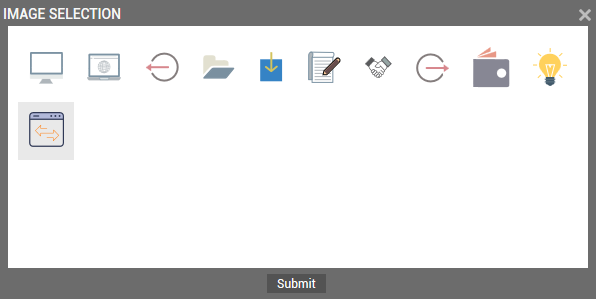
Figure 6 : Choosing an appropriate image for a transaction
Here, select the icon of your choice and click the Submit button.
Clicking on any transaction name or the state of the transaction will lead you to the layer model for the simulation as shown in Figure 9.
You can even filter the details displayed in the dashboard by picking the simulator for which you want to view the details. This can be achieved by picking a particular external agent from the External Agents drop-down (see Figure 7).
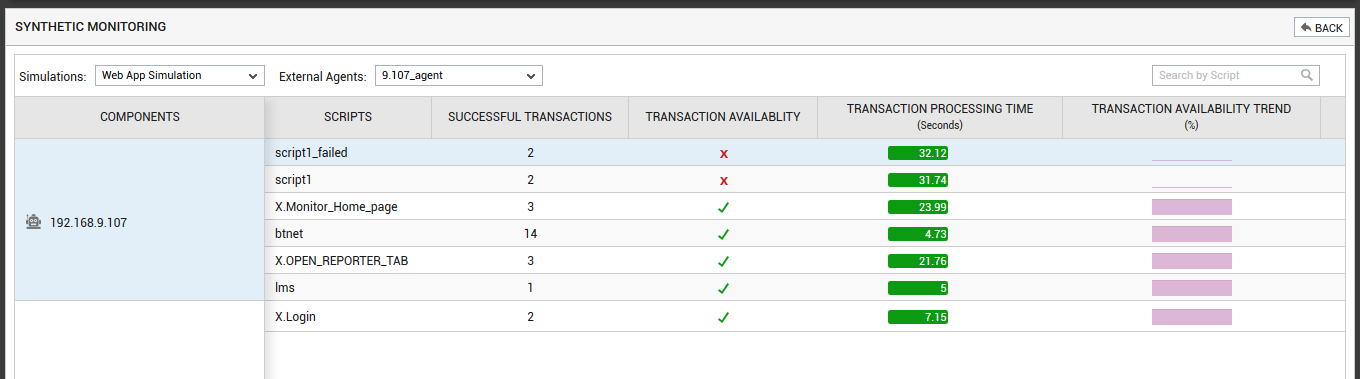
Figure 7 : Viewing the details of a particular simulation alone
Alternatively, you can filter the dashboard contents on the basis of the scripts that were recorded for the Web App Simulation component that you managed. You can specify the whole/part of the script name in the Search by Script search text box (see Figure 8) and click the ![]() icon alongside. This will display the details of only those scripts with names that contain the specified search string.
icon alongside. This will display the details of only those scripts with names that contain the specified search string.
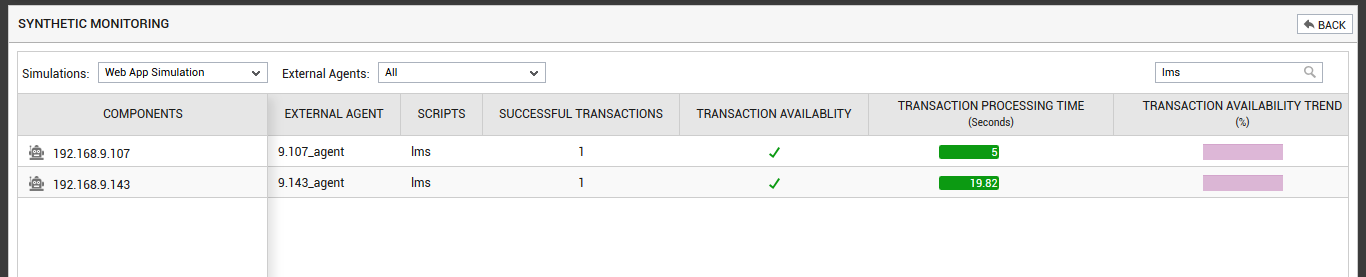
Figure 8 : Viewing the details of only those scripts that matched the search criteria
Clicking on any value specified against the scripts in the dashboard will lead you to the Layers tab page, where you can view the metrics reported by the simulation and the current state of each metric.
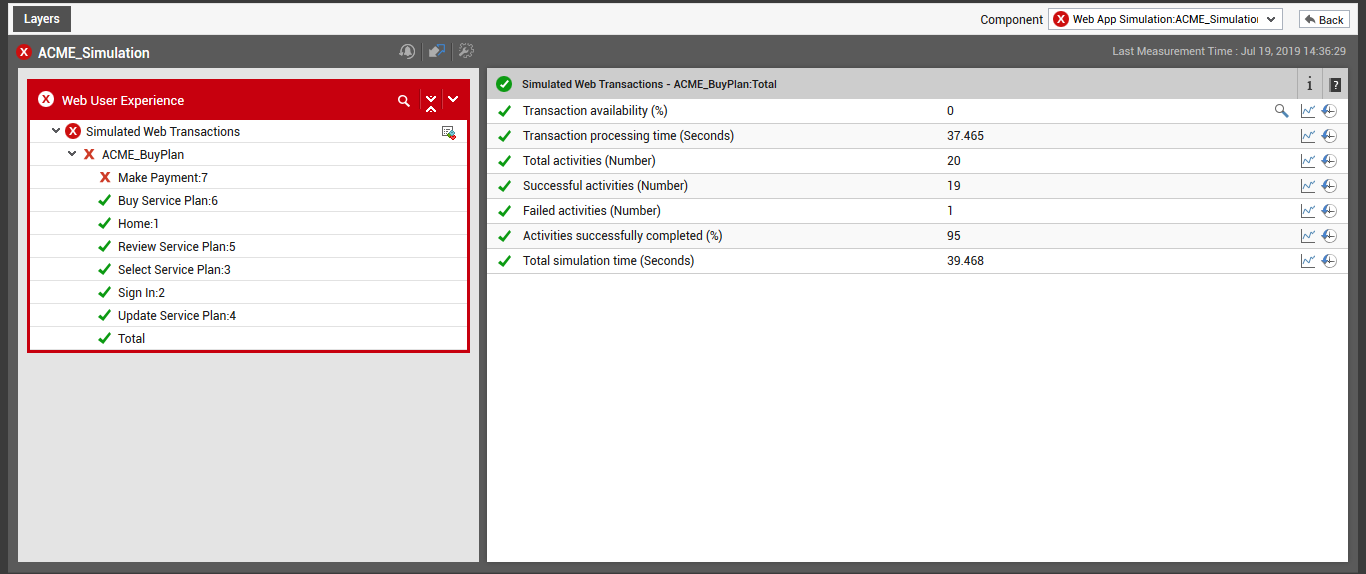
Figure 9 : The layer model of the Web App Simulation component that was clicked on
Clicking the  icon in the layer model page (see Figure 9) will lead you back to the transaction flow graph as shown in Figure 2.
For historical analysis of the simulated results, the eG Reporter provides a Web App Simulation Report . This report can be generated for one/all simulations, or for one/all external agents. To know more on how to generate the Web App Simulation report, refer to Web App Simulation Reports .