Monitoring the eG Agent
The eG Enterprise provides a dedicated eG Agent monitoring model that monitors the functioning of the eG agent at configured frequencies and reports abnormalities (if any).
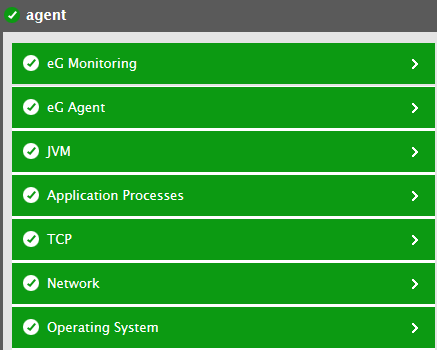
Figure 1 : Layer model of the eG Agent
Each layer of Figure 1 above is mapped to tests that report a wealth of performance information related to the eG agent. To pull out these performance metrics, the eG agent can be deployed on the eG agent host itself (agent-based) or on any remote Windows host in the environment (agentless).
By executing the tests pertaining to the eG agent, eG administrators can find quick and accurate answers for the following queries:
- Is the eG agent communicating with the eG manager?
- For how many components did each test execute and report metrics to the eG agent?
- What is the minimum time and the maximum time taken to execute each test?
- What is the average time taken to execute each test?
- How many tester threads are available for executing each test?
- How many tester threads are currently executing each test?
- What is the percentage of tester threads utilized by each test?
- How well each test is reporting metrics in terms of percentage?
- How many tests are executing and reporting metrics to the target eG agent?
- How many files were stored in the data folder of the target eG agent?
- What is the size of the files stored in the data folder of the target eG agent?
- How long does the eG agent take to upload the data collected by executing the tests to the eG manager?
- How many virtual machines/desktops are monitored by the target eG agent?
- How many virtual machines/desktops are currently powered on?
- From how many virtual machines/desktops did the target eG agent collect the inside view metrics successfully?
- How many virtual machines/desktops from which the target eG agent was unable to collect the inside view metrics?