Change by Time
Change management is an integral component of configuration management. In recent times, it has been observed that a majority of performance issues experienced by IT infrastructures are owing to improper / unauthorized changes to configuration. It is therefore essential for administrators to track the configuration changes effected in an IT environment on a regular basis so that, erroneous changes can be promptly identified and rolled back. To enable administrators to efficiently monitor configuration changes and easily view what was changed, when, and by whom, the eG Configuration Management console provides a variety of interfaces. The CONFIGURATION CHANGE : DAYWISE DISTRIBUTION page is one such interface. Using this page, you can view a quick summary of the configuration changes that were effected on a chosen component-type, every day during a specified timeline. If you are investigating the reason behind the abnormal behavior of one/more components of a type on a particular day in the past, then this page will help you determine whether the anomaly was owing to configuration changes that were made on the components of that type on that day.
To access this page, use the Changes -> By Time menu sequence.
By default, this page provides a bar graph indicating the count of configuration changes that were effected across all component types during every hour of the last 24 hours (1 day). Accordingly, the All and 1 day options are chosen by default from the Component Type and Timeline drop-down lists, respectively.
To view the number of changes that were effected on the components of the chosen type for a specified timeperiod do the following:
- Pick a particular component-type from the Component Type list as depicted in Figure 1.
- Next, provide a different Timeline for the change summary.
- Next click the SUBMIT button.
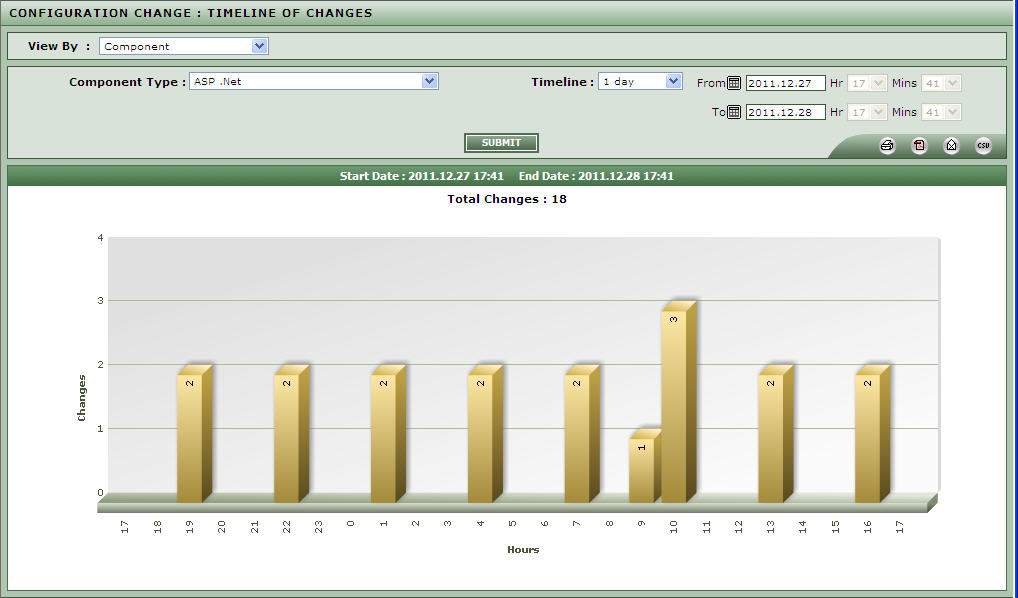
Figure 1 : Viewing configuration changes for a specific component type for a specific time period
- When this is done, the resulting graph will indicate the number of changes that were effected on the components of the chosen type, every day of the specified timeline. Clicking on a bar that corresponds to a particular day/hour in this graph, will lead you to the CONFIGURATION:DETAILED page, using which, you can clearly identify the components (of the chosen type) that were impacted by the changes made on that day/hour, and also figure out what these changes were.