Comparison - By Measure
Though eG Enterprise is capable of comparing a component to figure out which configuration change really impacted the performance of the component, the exact measure that caused down slide of the performance and the exact time during which the performance impact started could not be figured out at a single glance. To address this issue, the COMPARE MEASURE CONFIGURATION page is introduced in the eG Configuration management module. Using this page, the two most recent configuration snapshots of a component in a given period of time is taken and the config details are compared side-by-side and line-by-line.
This page can be accessed by using the Configuration -> Compare -> Measure Configuration menu sequence.
To compare the configuration of measures, do the following:
- Select a component type from the Component Type list box as depicted in Figure 1.
- All the components corresponding to the chosen Component Type will be listed in the Component list. Pick a component from this list.
- All the configuration parameters that correspond to the chosen component will then be populated in the Information list box. To compare the value of a particular parameter across components, select that parameter alone from the Information list box; to compare the complete configuration of a component with that of the others, select all the options listed in the Information text box.
- Next, select a measure from the Measure list box as depicted in Figure 1; the current configuration of this measure will be compared with that of the last known configuration.
- Next, choose a Timeline during which the configuration should be compared.
-
Then, click the SUBMIT button (see Figure 1).
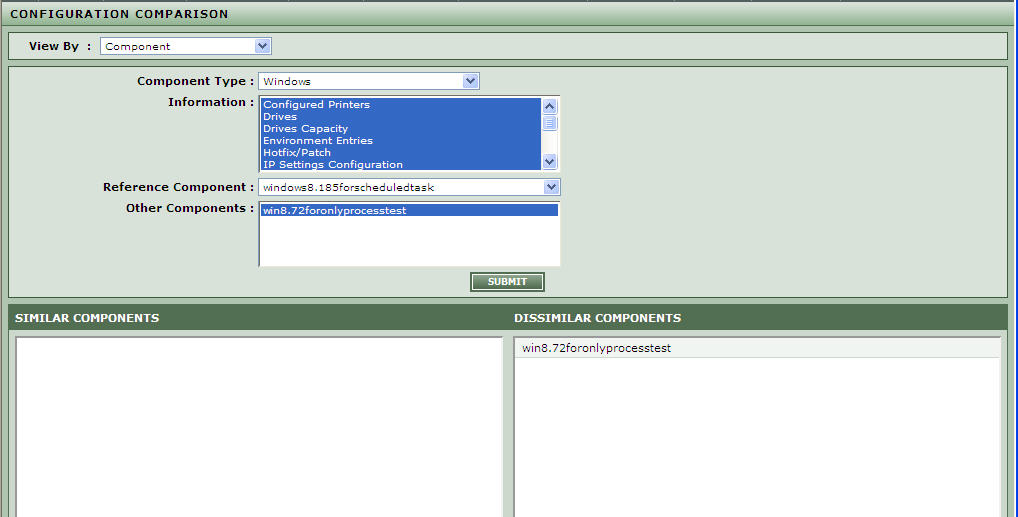
Figure 1 : Selecting the measure for which configuration is to be compared
-
This will invoke a Previous Value column and a Present Value column using which the values of the measure can be compared easily and the discrepancies in the measure can be identified at ease!
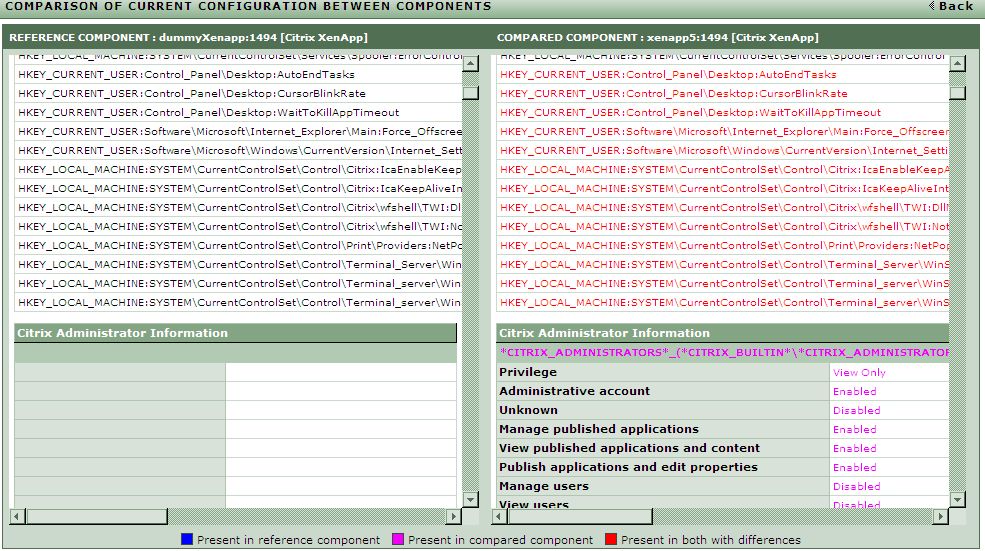
Figure 2 : Comparing the current configuration of the measure with the last known configuration
-
The following color coding is used across this module to pinpoint the differences:
- Black: If the configuration parameters and their values are provided in the color Black, it denotes that no dissimilarities exist between the current configuration and the previous configuration of the measure.
- Blue: Values displayed in blue indicate those configuration entries that are available in the previous configuration, but not in the current configuration.
- Pink: Values displayed in pink indicate those configuration entries that are not available in the previous configuration, but exist in the current configuration.
- Red: Text in red are indicative of configuration parameters that exist in both the configurations, but the values have changed in one of the configuration.