Configuration Management Home Page
This page enables the administrator to understand, at a glance, the software, service, hotfix, and operating system configuration of the components in the monitored environment, and provides a quick summary of the configuration changes that were effected in the environment in the recent past. The details are as follows:
-
The first section of the page provides the details of Machines or hosts that are being monitored in the target environment. By default, this section displays a pie chart depicting the distribution of machines on the basis of the operating systems available in the environment as depicted in Figure 1. Accordingly, the By OS option is chosen by default from the drop-down list at the right, top corner of this section. Using the pie chart, you can determine the type of operating systems that are currently in use in the environment, and the number of installations of each operating system. This information enables administrators to efficiently track the usage of OS licenses across the environment and plan the purchase of additional licenses (if required). To quickly identify the machines on which a particular OS has been installed, simply click on a particular slice in the pie chart; this will lead you to the INVENTORY BY OPERATING SYSTEM page that provides a version-wise list of machines that are currently using the corresponding operating system.
If you select the By OS Version option from the drop-down list at the right, top corner of the Machines section, then a table displaying the following details will appear:
- The OS installed in the machines Version of the OS
- The number of installations of each OS in the target environment
Besides helping you keep tabs on license consumption, this information also enables you to effectively plan future upgrades / installations. In other words, if one/more operating systems need to be upgraded, or if service packs/hotfixes need to be deployed on an operating system, then the information provided here will help you assess your workload and accordingly plan and schedule your work. Clicking on an Operating System here will once again take you to the INVENTORY BY OPERATING SYSTEM page, using which you can quickly identify the machines that are running on a particular version of an operating system.
To view the number of network devices that have been managed in the environment, pick the Network Devices option from the drop-down list at the right, top corner of the Machines section. Doing so will reveal a distribution pie chart depicting the number of network devices of each type that are currently monitored. Likewise, select the Virtual Servers option to know which virtualized platforms are in use in the environment, and how many servers per platform are currently managed. Clicking on a slice in the Network Devices pie chart will reveal which devices of a type are currently managed. Clicking on a slice in the Virtual Servers pie chart will reveal the managed virtual components of the virtualized platform that is clicked on.
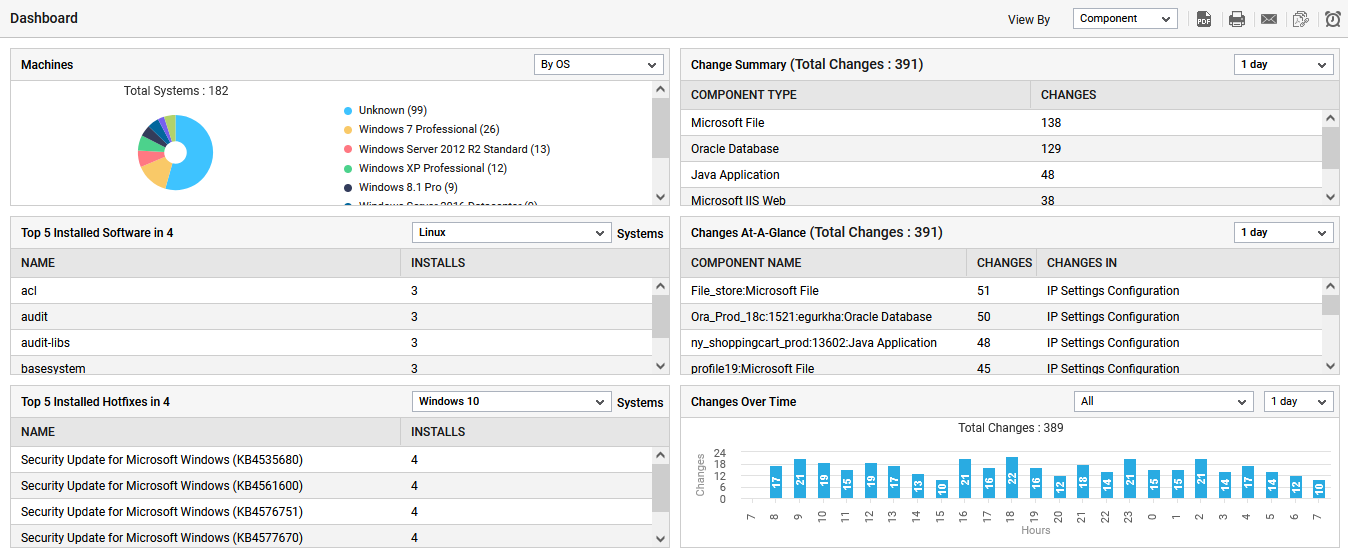
Figure 1 : Home page of configuration management
Note:
As stated earlier, the By OS option is the default selection in the drop-down list, in the Machines section. To override this default setting, use the menu sequence Settings -> Dashboard ->Other panels, and set the Machine Distribution flag in the page that appears to By OS Version. Save the changes to the page by clicking the Update button therein.
-
Below the Machines section, you can view the Top-N software or hotfixes installed on a chosen operating system. By default, this section displays the top 5 Software (in terms of number of machines on which the software has been installed) installed on a particular operating system. To view the top hotfixes, select the relevant option from the drop-down list adjacent to the label Installed in this section. Also, note that eG Enterprise discovers all the operating systems that are in use in the environment, arranges them in the ascending order of the OS names, and selects the first OS in the sorted list as the default operating system for consideration by this section. You can choose a different operating system by selecting another option from the drop-down list adjacent to the text in the section title.
This section lists the names of the top-5 (by default) software/hotfixes installed on a particular OS across the environment, along with the number of Installs of every software/hotfix. This information helps you ascertain, from a single glance, whether all software, and hotfixes that are critical to the functioning of a chosen OS are available on all installations of that OS. For instance, if a critical anti-virus software has to be present on all Windows machines in the environment, you can effortlessly verify the availability of this software using the details provided by this section.
Clicking on a software/hotfix here will lead you to the corresponding INVENTORY page, using which you can instantly identify the systems on which the software/hotfix clicked on is available and the systems on which it is not available.
-
Adjacent to the Machines section is the Change Summary section. This section provides you with a quick look at the component-types for which configuration changes have been made during the last 1 day (by default), and the number of changes that were effected per component-type. This way, administrators of individual application silos in an environment - say, database administrator, web server administrator, etc. - will receive an overview of the configuration changes that applications of interest to them have undergone during the last 1 day (by default). By choosing a different duration from the drop-down list at the right, top corner of this section, you can view the change summary for a broader time period (say, 2 days, 3 days, etc.). For further analysis of the changes, click on a Component Type displayed in this section. This will lead you to the CONFIGURATION CHANGE : DETAILED - COMPONENT TYPE page, which will enable you to instantly infer which components of the chosen type have undergone configuration changes during the chosen period.
Note:
To override the default duration of 1 day, open the DASHBOARD SETTINGS:OTHER PANELS page using the menu sequence, Settings -> Dashboard ->Other panels, and pick a different option from the Change Summary section.
You can even indicate the duration options that need to be available for selection in the drop-down list.
You can alter this list, using the steps provided below:
- Edit the eg_configtests.ini file in the {EG_INSTALL_DIR}\manager\config directory.
-
In the [CONFIGURATION_CHANGE] section of the file, append the desired options to the comma-separated list available against the ChangeSummary parameter. For instance, to include the options 192 and 216, your specification should be:
ChangeSummary=24,48,72,96,120,144,168,192,216
-
Beneath the Change Summary section, a Changes At-A-Glance section is available, that provides a component-level change summary for the last 24 hours (by default). You can change the default time period by selecting a different option from the drop-down list at the right, top corner of this section. By choosing a specific time period, you can view the components that have undergone a configuration change during the chosen period, the number of configuration changes that were made per component, and also the configuration parameter that has changed. In the event of a problem with a component during a time period in the past, administrators can use this section to figure out whether the configuration of the component changed during the said period, what was the configuration change, and also determine whether this change could have contributed to the problem. Clicking on the component name or on the number of changes or on the type of changes will take you to the CONFIGURATION CHANGES : DETAILED - COMPONENT NAME page, which will provide you with a detailed description of the corresponding configuration changes.
Note:
To override the default duration of 24 hours, open the DASHBOARD SETTINGS : OTHER PANELS page using the menu sequence, Settings -> Dashboard ->Other panels, and pick a different option from the Changes At-A-Glance section.
You can even indicate the duration options that need to be available for selection in the drop-down list. By default, the following options will be available: 24,48,72,96,120,144,168. You can alter this list, using the steps provided below:
- Edit the eg_configtests.ini file in the {EG_INSTALL_DIR}\manager\config directory.
-
In the [CONFIGURATION_CHANGE] section of the file, append the desired options to the comma-separated list available against the ChangesAtAGlance parameter. For instance, to include the options 192 and 216, your specification should be:
ChangesAtAGlance=24,48,72,96,120,144,168,192,216
-
The Changes Over Time section, by default, provides a graph indicating the count of configuration changes that were effected across the environment, every hour during the default period of 1 day. Accordingly, the All and 1 day options are chosen by default from the drop-down lists available in this section. To view a quick summary of the configuration changes that were made for a specific component-type during a different time period, select a different option from both these drop-down lists. Administrators of specific application silos in an environment will find this change distribution graph useful, as it would help them closely track, on a daily basis, the number of configuration changes that were made to the applications of interest to them. Clicking on the bar corresponding to a particular day in this bar graph, will take you to the CONFIGURATION CHANGES : DETAILED - ALL COMPONENTS page. This page provides detailed information pertaining to the configuration changes, that were performed on the chosen component on the day clicked on.
Note:
To override the default duration of 1 day, open the DASHBOARD SETTINGS:OTHER PANELS page using the menu sequence, Settings -> Dashboard ->Other panels, and pick a different option from the Daywise Change Distribution list.