Dashboard settings: Other Panels
This page enables you to customize the Configuration Management Dashboard according to your preferences.
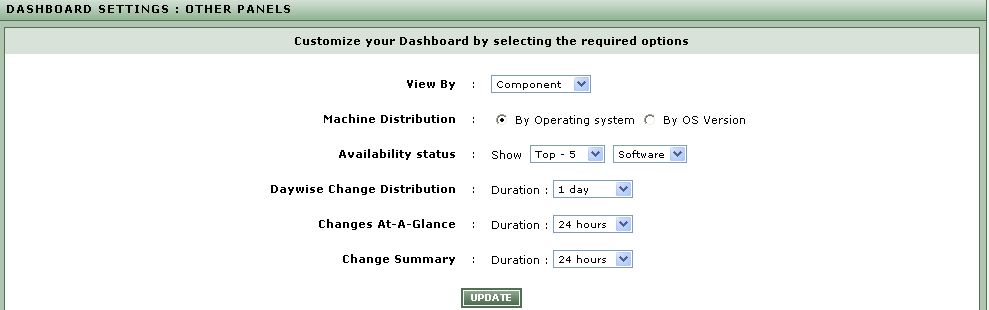
This page can be accessed by following the menu sequence: Settings->Dashboard->Other Panels.
To customize the dashboard, do the following:
- By default, the dashboard provides you with an overview of the software, service, hotfix, and operating system configuration of the managed components in the target environment, and also provides a quick summary of the configuration changes that were effected on these components in the recent past. Owing to this component-focus, the Component option is chosen by default from the View By list in the dashboard as depicted in Figure 1. You can override this default behavior by selecting a different View By option from this page.
- In the Machines section of the home page, the By OS option is chosen by default from the drop-down list, indicating that, by default, the Machines section reveals how machines are distributed across the environment based on operating system. To ensure that the Machines section in the home page depicts machine distribution based on the OS version by default, select the By OS Version option from the Machine Distribution section in this page.
- By default, the home page indicates the Top-5 Software in the environment, in terms of the number of installs. This display is governed by the Availability status flag in this page; this flag is by default set to Show the availability status of the Top-5 Software only. To override this default setting, select a different Top-N option from the Show list in the Availability status section, and then pick the Software,Services, or Hotfixes option from the drop-down list next to it.
- By default, the home page displays the Daywise Change Distribution for the last 1 day only. This is because, the Daywise Change Distribution flag in this page is set to 1 day by default. To override this default setting, pick a different option from the Daywise Change Distribution list in this page.
- To override the default duration for the Changes At-A-Glance section of the dashboard, select the desired option from the Changes At-A-Glance list in this page.
- To change the default duration for the Change Summary section of the home page, select the desired option from the Change Summary list in this page.
- You can personalize your dashboard further by picking a color of your choice for the bar graphs, that are displayed in the Daywise Change Distribution section of the dashboard. For this, select the color from the Bar Chart Color list box. If your choice of color is not available in this list box, you can specify a color code in the text box which is provided followed by #. To specify the code, make sure the Other option is selected from the Bar Chart Color list box. Clicking on the View button will allow you to view the color that you have chosen, or the color that corresponds to the code you have specified.
-
Finally, click the UPDATE button to implement the changes (see Figure 1).