eG Agent Installation
The eG agents monitor the environment by running periodic tests and use different approaches for testing the target environments. Based on the monitoring approach employed and where they are installed, agents are classified as follows:
Internal Agents are installed on the same machines that they monitor and have the ability to run many tests. This will be the most common method of monitoring and is suitable for monitoring applications, servers, operating systems, etc. A single agent on a server can monitor any number of applications and also different types of applications (for example, web servers, middleware, messaging applications, enterprise applications, databases, etc.) running on it. Because of its multiple application support and one-agent-fits-all approach, this agent is also called a Universal Monitoring Agent.
Remote Agents are proxies for internal agents in the sense that they perform similar tasks – just that they are deployed outside the target system they are intended to monitor. These agents connect remotely to the target systems using protocols such as JMX, SSH, SMI-S, web services APIs (e.g., virtual platforms), etc. for monitoring. This forms an agentless monitoring approach for servers and devices. Remote agents are typically used in cases where it is not recommended to install an internal agent – for example, on a VMware hypervisor where any software installation on the console operating system is to be avoided; or a storage device, where it is not possible to deploy an agent. For more details on agentless monitoring using remote agents, refer to the Agentless Monitoring topic in Administering eG Enterprise.
External Agents are mainly used for black box monitoring of network devices, servers, and applications. Typical functions include tracking network availability and responsiveness via PING tests and application availability and responsiveness by making TCP port connections. These agents also make protocol level requests for protocols such as HTTP, SMTP, FTP and others to report service availability and responsiveness. These same agents can be used to monitor network switches, routers, firewalls, printers and so on using SNMP. This also forms an agentless monitoring approach.
For making measurements, eG agents support various mechanisms. The Simple Network Management Protocol (SNMP) continues to be the standard for monitoring network elements (routers, load balancers, WAP gateways, etc.). Besides monitoring network elements, eG agents also manage systems and applications. SNMP is rarely supported at the application layer. Hence, for monitoring applications, eG agents support various other mechanisms:
- Emulated transactions: By emulating typical transactions from clients to different applications, eG agents monitor various aspects of the server. For example, to measure the health of a web server, eG Enterprise uses an HttpTest that emulates user accesses to the web server. Depending on whether and when a response is received or not, as well as based on the status code returned by the server in the Hyper Text Transport Protocol (HTTP) response returned by the server, the eG agent assesses the availability of the web server and the response time for the request.
- SNMP data collection: To monitor the various network elements and any other application components that support SNMP, eG agents support SNMP-based monitoring.
- OS-specific instrumentation: Server operating systems already collect a host of statistics regarding the health of the server and processes executing on it. For example, CPU, memory, and disk space utilizations, network traffic statistics, process-related measures can all be collected using operating system specific hooks. eG agents use these hooks to collect and report a variety of statistics of interest.
eG agents have been pre-programmed to execute specific tests for web servers, SSL servers, LDAP servers, DNS server, Database servers, and application servers. For components that are not included in the core eG Enterprise system, the eG professional services team provides customization services that include studying the behavior of a component, designing, and implementing tests for the component, and integrating the new component into the eG management framework.
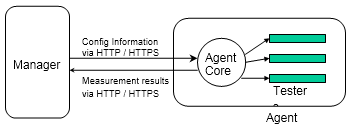
Figure 1 : The manager-agent communication in the eG architecture
All manager-agent communication happens over the HTTP / HTTPS protocol. The agent uses tester threads, each of which is responsible for a specific test. The main functions of the agent core are:
- To read configuration information from the manager and determine what tests are to be executed on a host.
- To periodically refresh the configuration information from the manager and determine if any of the testers needs to be stopped or restarted, or whether the configuration information for any of the tests needs to be changed.
- To read the threshold information from the manager and use it to determine whether the state of each measurement is normal or not
- To provide alarms to the manager in the event that the state of any measurement changes
- To upload measurement results back to the manager for permanent storage.
Figure 2 depicts the typical deployment architecture of eG Enterprise. The eG manager is installed on a server called the eG server. By default, an external agent is also hosted on this system. Internal agents are installed on all the other servers being monitored in this environment. The configuration of external agents can be modified to suit the target environment. For example, in Figure 2, an external agent is located within each customer’s network (in the case of a service provider servicing multiple customers) or within each network domain (in the case of a corporate Intranet that comprises of different independent domains).
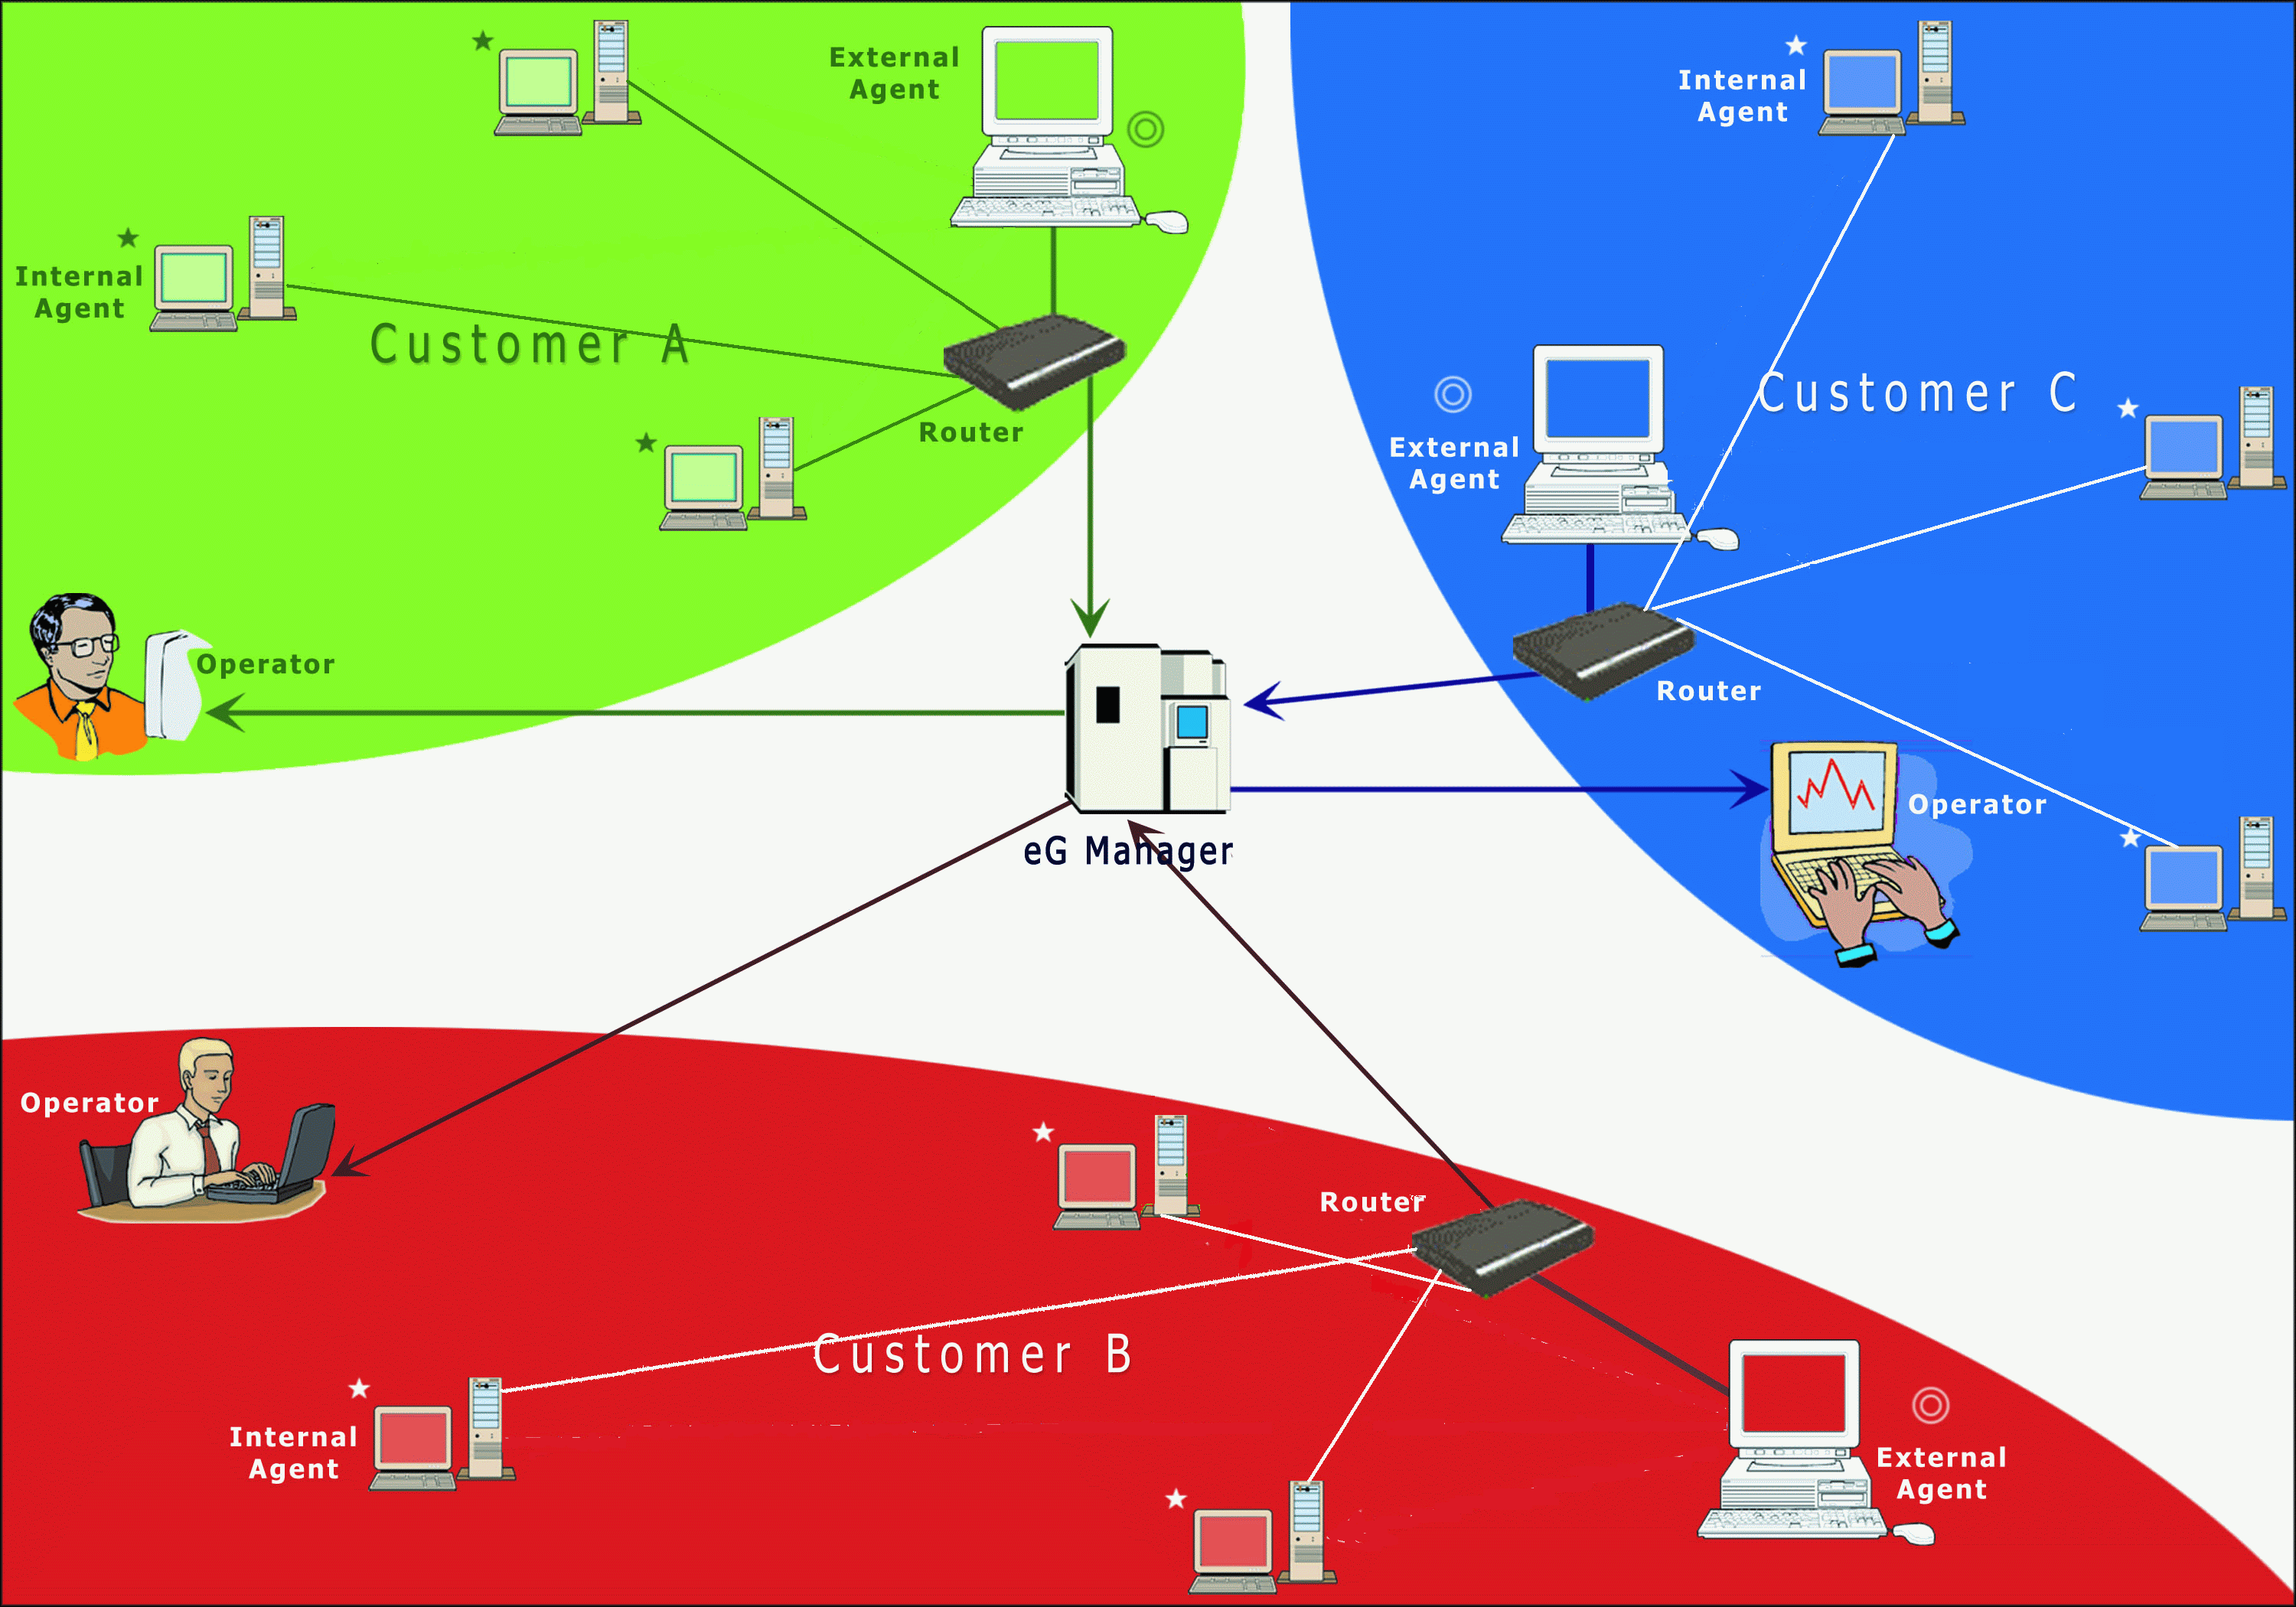
Figure 2 : A typical deployment architecture of eG Enterprise