Configuring the Basic Settings for the ITSM/Collaboration Integration
Before attempting the trouble ticketing (TT) integration, you need to indicate the following:
- What alarms should be forwarded to the TT system?
- Should detailed diagnostics be sent to the TT system?
- Should normal alerts be routed to the TT system?
- Should logging be enabled? If so, what should be the maximum size of the log file? how many log files should be created?
- Do you want to filter alarms of any specific component type/component/layer/test/descriptor?
To configure the above, follow the steps outlined below:
- Login to the eG administrative interface.
- Select the ITSM/Collaboration Integration option from the Alerts menu in the Admin tile.
-
Figure 1 will then appear. Keep scrolling down Figure 1 until the Settings option becomes visible. Click on the Settings option.
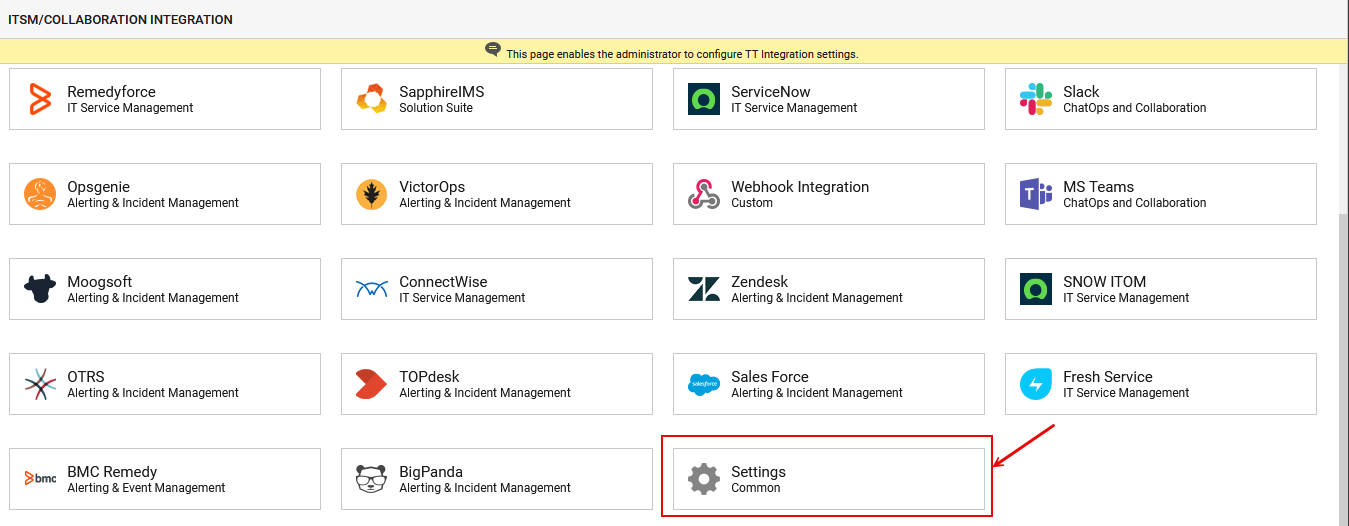
Figure 1 : Selecting the Settings option from the ITSM/COLLABORATION INTEGRATION page
-
A Settings section will open in the right panel, as depicted by .
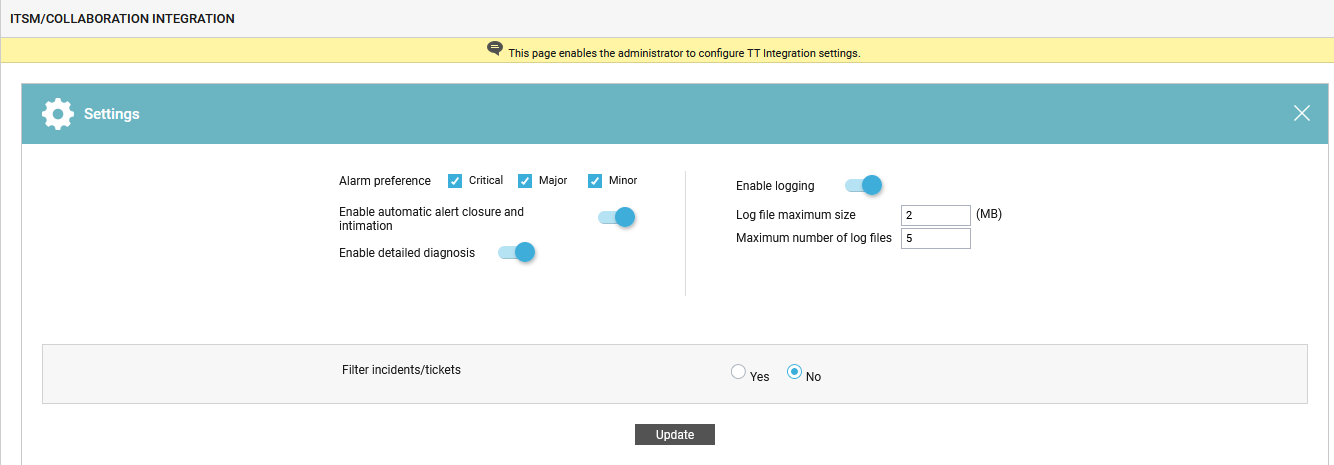
Figure 2 : Configuring the common integration settings
- From this section, first select the type of alarms that the eG manager should send to the TT system after the integration. For this, select the Critical, Major, and/or Minor check boxes against Alarm preference.
- If you want the TT system to be intimated if a problem is resolved, so that the corresponding trouble ticket is automatically closed, then enable the Enable automatic closure and intimation slider by dragging it to the right.
-
To ensure that detailed diagnostics, if available, are sent along with alarm information to the TT system, enable the Enable detailed diagnosis slider by dragging it to the right.
Note:
Even if this slider is set to enabled, the eG manager will send detailed diagnostics to the TT system, only if the following conditions are fulfilled:
- The Detailed Diagnosis capability should be enabled in the eG license.
- In case of a redundant manager configuration again, all the eG managers that are part of the cluster should have the detailed diagnosis capability enabled in their respective licenses.
- Both the normal and abnormal frequencies configured globally or at the test-level for collecting detailed measures should not be 0.
- The detailed diagnosis flag at the test-level, should be set to On.
The eG manager should integrate with the TT system via the TT mail interface or the TT CLI only.
-
Next, if you want the eG manager to track the alarms routed to the TT system and the errors, successes, and failures in the process, you can optionally configure the eG manager to maintain logs of the same. To trigger log generation, enable the Enable logging slider by dragging it to the right.
Note:
- Regardless of the status of this slider, logs will not be generated if eG alarms are transmitted to the TT system via the TT mail interface.
-
Where the eG manager integrates with a TT system via the TT CLI, setting this flag to Yes will result in the automatic creation of a ttexec.log file in the <EG_INSTALL_DIR>\manager\logs directory. By default, these log files capture both the errors and the standard output of the specified Command. A sample log is provided below, where both standard output and errors have been logged:
03/11/2009 18:25:03 INFO AlarmId “192.168.10.133_1257252903826” –DATE “Nov 03, 2009” –TIME “18:25:02” –Priority “Critical” –ComponentType “Generic” –ComponentName “gen133:NULL” –Layer “Application Processes” –Desc “-|Processes|Process not running{cmd}|gen133” –Service “-“#AlarmId “192.168.10.133_1257252903842” –DATE “Nov 03, 2009” –TIME “18:25:02” –Priority “Major” –ComponentType “Generic” –ComponentName “gen133:NULL” –Layer “Application Processes” –Desc “-|Processes|Process not running{notepad}|gen133” –Service “-“
03/11/2009 18:36:12 ERROR Executing command – ech AlarmId “192.168.10.133_1257253386239” –DATE “Nov 03, 2009” –TIME “18:32:37” –Priority “Normal” –ComponentType “Generic” –ComponentName “gen133:NULL” –Layer “Application Processes” –Desc “-|Processes|Process not running{cmd}|gen133” –Service “-“#AlarmId “192.168.10.133_1257253386255” –DATE “Nov 03, 2009” –TIME “18:32:38” –Priority “Normal” –ComponentType “Generic” –ComponentName “gen133:NULL” –Layer “Application Processes” –Desc “-|Processes|Process not running{notepad}|gen133” –Service “-“
03/11/2009 18:36:12 ERROR ‘ech’ is not recognized as an internal or external command, - Where the eG manager integrates with a TT system via a web services framework, enabling this slider will result in the automatic creation of <TT_System_Name>_log file in the <EG_INSTALL_DIR>\manager\logs directory. By default, these log files capture both the errors and the standard output.
- This slider cannot be used to enable logging of SNMP trap transmissions to SNMP managers. Where TT integration is enabled over SNMP traps, logging should be enabled using the procedure discussed in Section 3.3.
-
Once the Enable Logging slider is enabled, you will be allowed to indicate the maximum size (in MB) up to which the log file should be allowed to grow using the Log file maximum size text box. The default size is 2 MB. In the Maximum number of log files text box, specify the maximum number log files that can be created when the log file grows beyond the size limit configured in the Log file maximum size. The default value is 5.
- Where the eG manager uses the TT CLI to integrate with a TT system, if the ttexec.log file grows beyond the size limit configured in the Log file maximum size text box, the details originally logged in the ttexec.log file will be moved to another log file named ttexec.log.1, and the newer information will be logged in the ttexec.log file. This log roll over mechanism helps ensure that the log file does not grow beyond control.
- Where the eG manager uses the web services framework to integrate with a TT system, if the <TT_System_Name>_log file grows beyond the size limit configured in the Log file maximum size text box, the details originally logged in the <TT_System_Name>_log file will be moved to another log file named <TT_System_Name>_log.1, and the newer information will be logged in the <TT_System_Name>_log file. This roll over will continue until a maximum of 10 log files are created – i.e., until a log file named <TT_System_Name>_log.9 is created. After this point, the eG manager will automatically delete the <TT_System_Name>_log.9 file, as it contains the oldest logs.
-
By default, alarms related to all issues pertaining to all component types will be forwarded to the TT systems. Then, the TT systems will create tickets/incidents based on the alarms and send them to you. Sometimes, you may want to receive incidents/tickets only for the alarms pertaining to specific component type/component/layer/test/descriptor that supports business critical services. To enable such selective alerting, eG Enterprise provides you with the option to configure the eG manager to filter the incidents/tickets. By default, the ability to filter incidents/tickets is disabled. To enable it, select Yes against the Filter incidents/tickets flag in . This will reveal the options for filtering the incidents/tickets as shown in Figure 3.
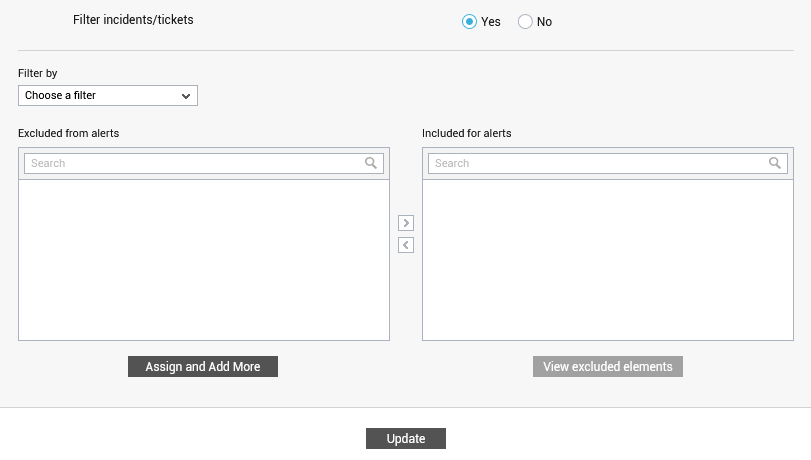
Figure 3 : Enabling the Filter incidents/tickets flag
Now, do the following to filter the incidents/tickets of your interest:
-
Choose a filter type from the Filter By list box, based on which the incidents/tickets are to be filtered. The available filter options are as follows:
- Component type
- Component
- Layers
- Tests
- Descriptors
-
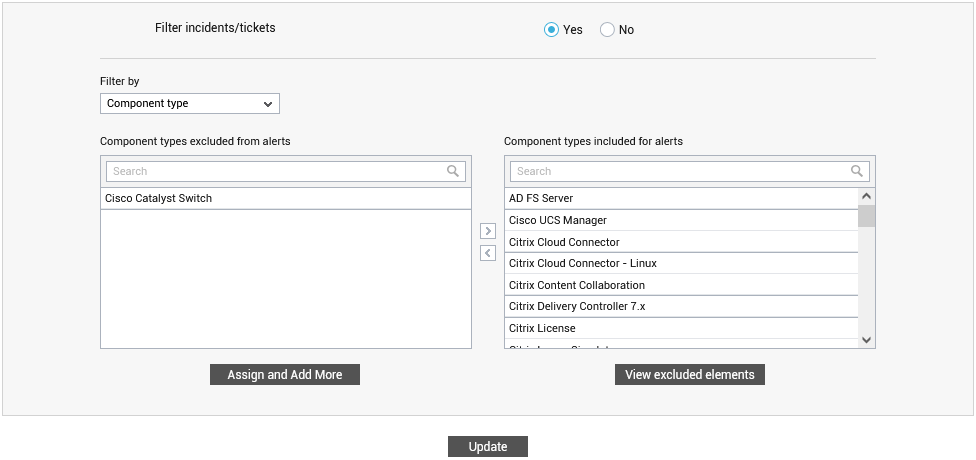
If you choose Component type from the Filter By list box, all the component types will appear in the Included for alerts list as depicted by Figure 3. Now, proceed as follows:
- From the Component Type Included for alertslist of Figure 3, select the component types for which you wish to suppress the alarms to be forwarded to the TT systems, and then click on the < button.
-
Clicking on < button will list all the chosen components in the Component Type Excluded from alerts list box as depicted by Figure 4. You can even double-click on a component-type in the Component Type Included for alerts list to immediately transfer it to the Component Type Excluded from alerts list.
- To include the excluded components, select the components from Component types Excluded from alerts list box and click on the > button. Alternatively, you can double-click on a component-type in the Component types Excluded from alerts list to immediately transfer it to the Component types Included for alerts list.
- Then, click on the Update button if you are done with filtering. On the other hand, if you want to proceed with excluding more elements, click on the Assign and Exclude More button.
-
If you do not want to create tickets/incedents for one/more components of a specific type, then, choose Component from the Filter By list box.
Note:
If alerts for a particular component-type have already been excluded for the chosen user by selecting Component type from the Filter By list box, then this excluded component-type will not be available for selection in the Component type list that appears upon selecting Component from the Filter By list.
-
Then, proceed as follows:
-
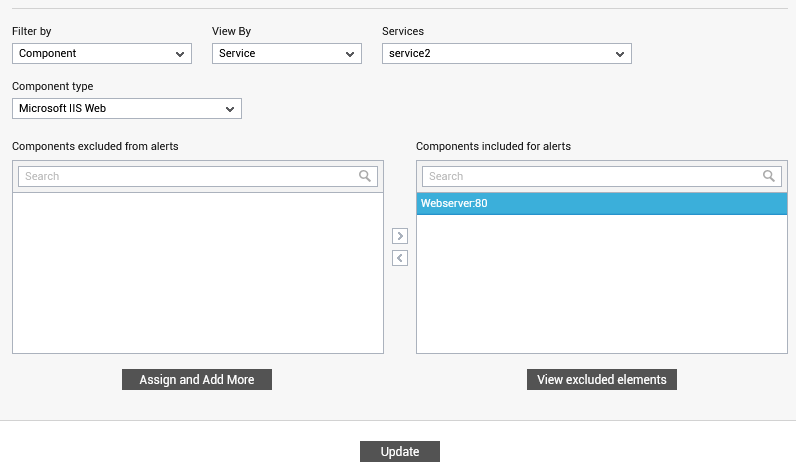
If hundreds of components have been managed in a target environment, then selecting the specific components for which alerts should not be forwared to the TT systems could prove to be a tedious task. To minimize the time involved in this exercise, eG Enterprise system allows you to additionally filter the components list on the basis of the option chosen from the View By list. By default, the Component option is chosen from the View By list. In this case therefore, all managed component types will be available for selection in the Component type list (seeFigure 5). On the other hand, if you choose the Segment, Service, or Zone option from the View By list, you will have to pick a particular Segment, Service, or Zone (as the case may be) to which the components for which alert filters are to be defined. In this case, the Component type list will be populated with all the component types that are part of the chosen Segment, Service, or Zone.
Note:
The View By list will appear only when the chosen component is associated with a Service, Segment or Zone.
-
From the Component type list, choose a component type. Doing so will list all the components of that type in the Components Included for alerts list box. Now, select the components to be excluded from the this list box, and click on the < button. You can even double-click on a component in the Components Included for alerts list to immediately transfer it to the Components Excluded from alerts list. Finally, click on the Finish button. If you want to add more elements for which alerts are to be filtered, click on the Assign and Exclude More button instead (see Figure 5).
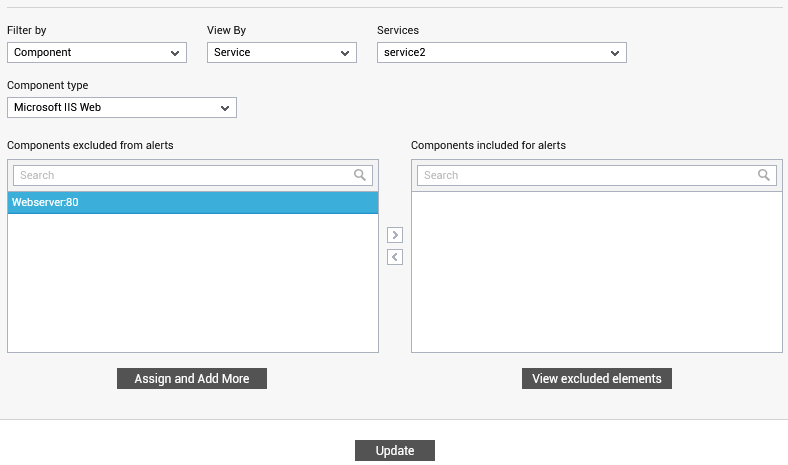
Figure 6 : Excluding alerts for specific components of a chosen type
-
-
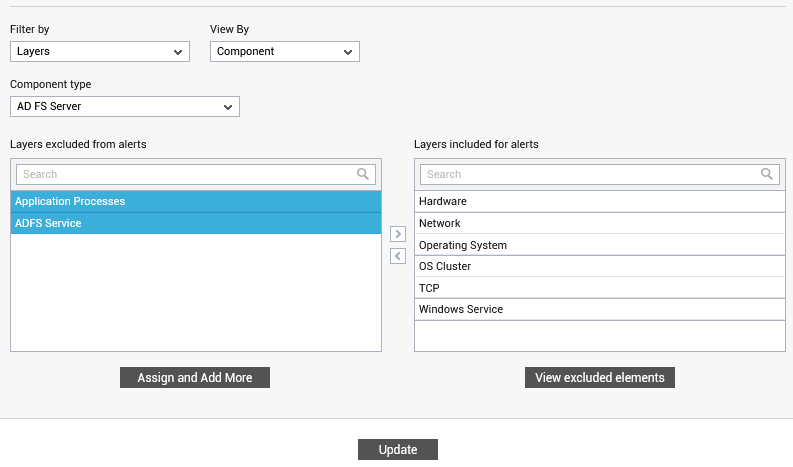
Likewise, you can suppress alerts for specific layers. For this, choose Layers from the Filter By list box. To further narrow-down the Component type list, pick the Component, Segment, Service, or Zone option from the View By list. The Component type list will be populated according to the option chosen from the View By list. Select any component-type from the Component type list (see Figure 7).
Note:
If email/SMS alerts for a particular component-type have already been excluded for the chosen user by selecting Component type from the Filter By list box, then this excluded component-type will no longer be available for selection in the Component type list that appears upon selecting Layers from the Filter By list.
-
This will list all the layers of the chosen component type in the Layers Included for alerts list box. Now, proceed as follows:
-
If you select All from the Component type list box, then the layers pertaining to all assigned components will be available for selection in the Layers Included for alerts list.
Note:
If email/SMS alerts for a particular component-type have already been excluded for the chosen user by selecting Component type from the Filter By list box, then all the layers pertaining to this excluded component-type will no longer be available for selection in the Layers Included for alerts list, if the Component type is set to All.
-
Next, select the layer to be excluded from the Layers Included for alerts list and click on the < button. Alternatively, you can double-click on a layer in the Layers Included for alerts list to immediately transfer it to the Layers Excluded from alerts list. Click on the Finish button to exit the mail/SMS alert filtering process, or click the Assign and Exclude More button to exclude more elements (see Figure 7).
-
-
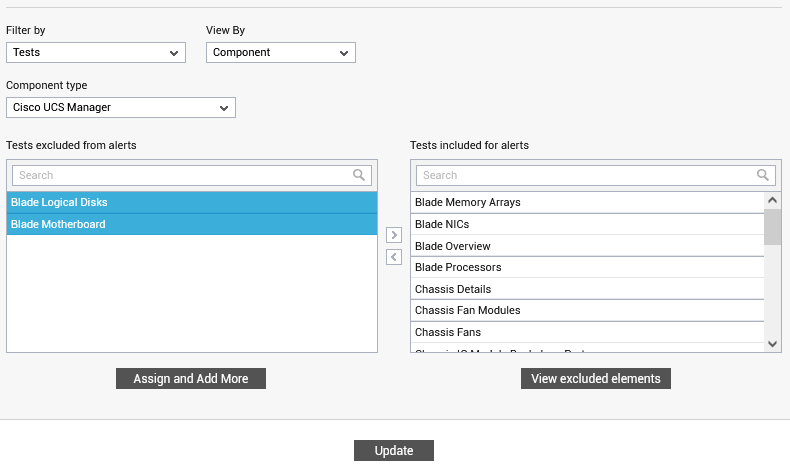
Similarly, you can suppress alerts for specific tests. For this, choose Tests from the Filter By list box, pick any option from the View By list to further filter the Component type list, and then select any component-type from the Component type list (see Figure 8). You can even exclude configuration tests by choosing the Configuration option from the Test type list. By default, Performance option is chosen from the Test type list.
Note:
If alerts for a particular component-type have already been excluded for the chosen user by selecting Component type from the Filter By list box, then this excluded component-type will no longer be available for selection in the Component type list that appears upon selecting Tests from the Filter By list.
-
This will list all the tests of the chosen component type in the Tests Included for alerts list box. Now, proceed as follows:
-
If you select All from the Component type list box, then the tests pertaining to all assigned components will be available for selection in the Tests Included for alerts list.
Note:
If email/SMS alerts for a particular component-type have already been excluded for the chosen user by selecting Component type from the Filter By list box, then all the tests pertaining to this excluded component-type will no longer be available for selection in the Tests Included for alerts list, if the Component type is set to All.
-
Next, select the test to be excluded from the Tests Included for alerts list and click on the < button. Alternatively, you can double-click on a layer in the Tests Included for alerts list to immediately transfer it to the Tests Excluded from alerts list. Click on the Finish button to exit the mail/SMS alert filtering process, or click the Assign and Exclude More button to exclude more elements (see Figure 8).
-
-
In the same manner, you can make sure that alerts are not sent out for specific descriptors of a test. For this, choose Descriptors from the Filter By list box. To further narrow-down the Component type list, pick the Component, Segment, Service, or Zone option from the View By list. The Component type list will be populated according to the option chosen from the View By list. Select any component-type from the Component type list (see Figure 7).
Note:
If alerts for a particular component-type have already been excluded for the chosen user by selecting Component type from the Filter By list box, then this excluded component-type will no longer be available for selection in the Component type list that appears upon selecting Descriptors from the Filter By list.
-
This will list all the descriptor-based tests associated with the chosen component type in the Test list and all managed components of the chosen type in the Component list (see Figure 9). Pick a Test and a Component from the respective lists. Then, proceed as follows:
-
All the descriptors that are currently active for the chosen Component and Test will be available for selection in the Descriptors Included for alerts list.
Note:
If alerts for a particular component-type have already been excluded for the chosen user by selecting Component type from the Filter By list box, then all the descriptors pertaining to this excluded component-type will no longer be available for selection in the Descriptors Included for alerts list, if the Component type is set to All.
-
Next, select the descriptor to be excluded from the Descriptors Included for alerts list and click on the < button. Alternatively, you can double-click on a layer in the Descriptors Included for alerts list to immediately transfer it to the Descriptors Excluded from alerts list. Click on the Finish button to exit the alert filtering process, or click the Assign and Exclude More button to exclude more elements (see Figure 7).
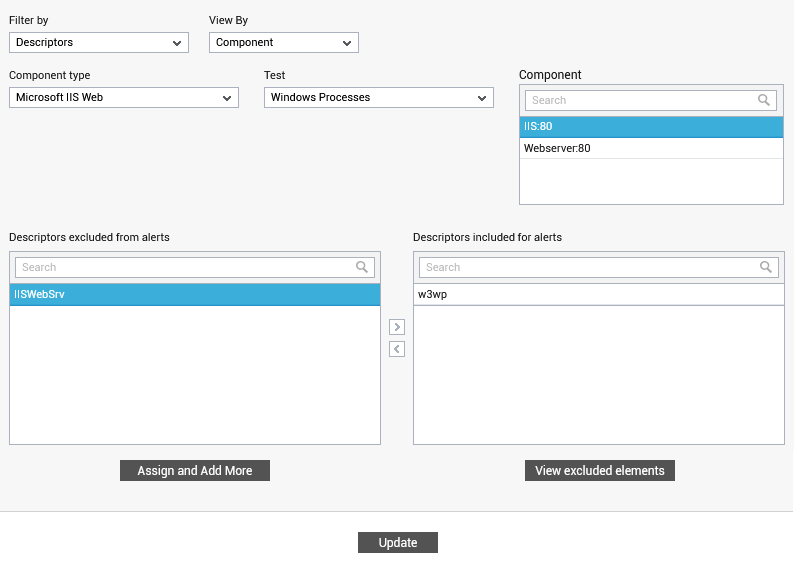
Figure 9 : Excluding specific descriptors of a component type
-
-
- Finally, click the Update button in to save the settings.