Trouble Ticket Integration Using the eG TT CLI
The eG manager can also be configured so that whenever it detects a new alarm, a change in an existing alarm, or a closure of an existing alarm, it executes a command with the appropriate parameters indicating the current status of the alarm. Note that this capability is available for stand-alone Windows managers, and Windows managers operating in redundant clusters only.
To configure this capability, do the following:
- Login to the eG administrative interface.
-
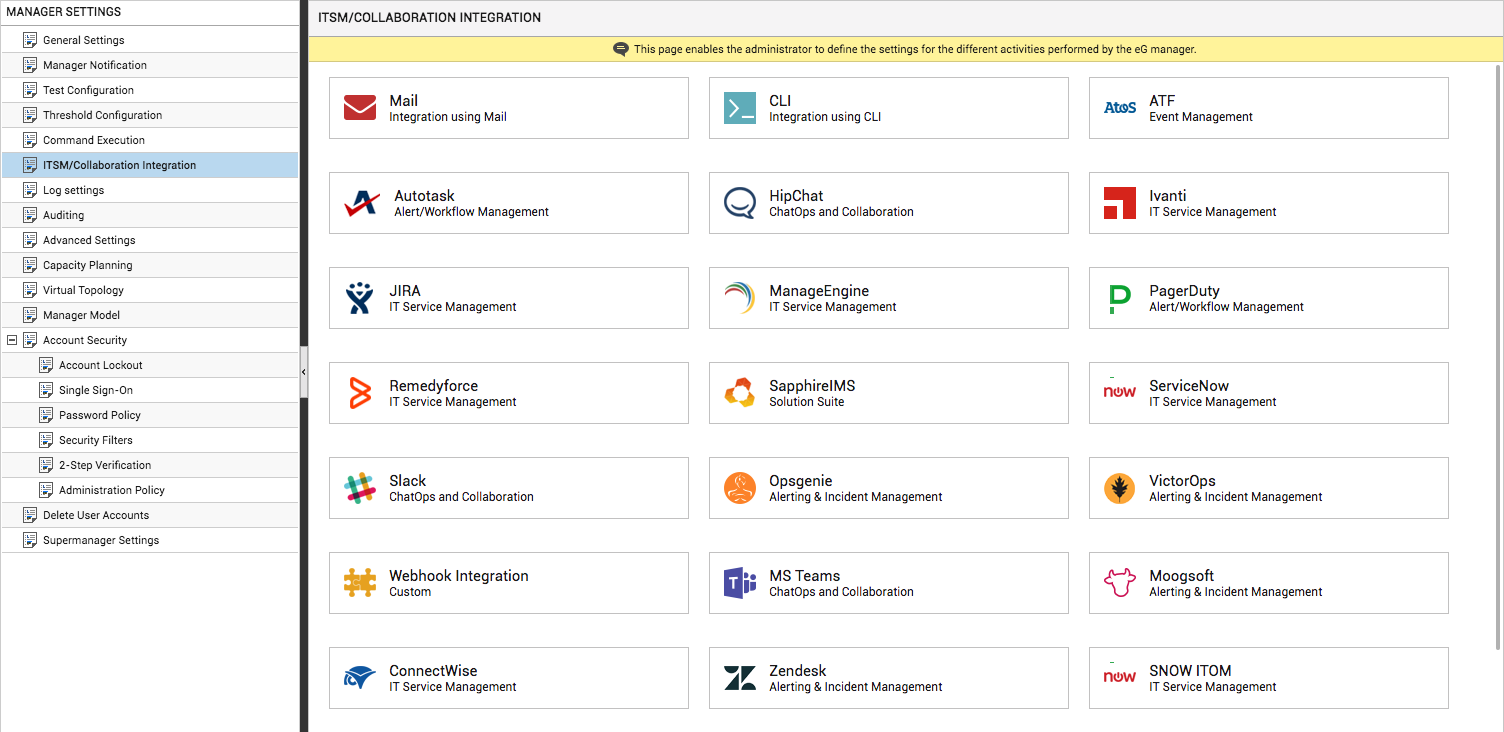
Select the Manager option from the Settings tile.
-
Figure 1 will then appear. From the manager settings tree in the left panel of Figure 1, select the ITSM/Collaboration Integration node. The third-party ITSM/Collaboration tools that eG Enterprise can integrate with will be listed in the right panel.
-
Now, click on the CLIoption in the right panel (see Figure 1). A CLI section will now appear in the right panel (see Figure 2).
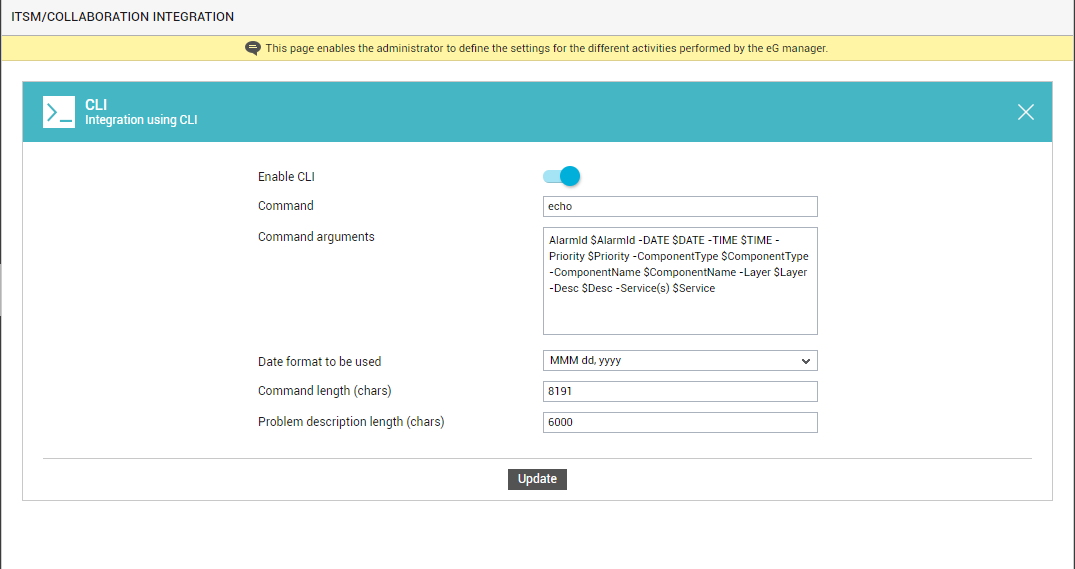
- Slide the Enable CLI slider (see Figure 2) to the right to enable this capability.
- In the Command text box, echo is displayed by default, indicating that the eG manager will execute an echo command by default to communicate with the TT system.
-
The Command arguments text box displays the default input parameters that the echo command takes during execution. These default parameters are as follows:
AlarmId $AlarmId -DATE $DATE -TIME $TIME -Priority $Priority -ComponentType $ComponentType -ComponentName $ComponentName -Layer $Layer -Desc $Desc –Service(s) $Service.
As you can see, each parameter is represented by a qualifier and a variable name. While the qualifier is typically prefixed by a hyphen (-), the variable name is prefixed by a $ symbol. These variables will be substituted by actual values during runtime. Using the qualifiers, you will be able to tell what value follows. For instance, at runtime, the parameter –Priority $Priority could appear as –Priority Critical. This implies that the Priority of the problem is Critical.
Note:
- You can alter the qualifier if you need to, but the variable names (the $ preceded strings in the previous example) should not be changed.
- The position of the qualifier-variable pairs can be changed in the command line – for instance, you can move the –Service $Service parameter to appear next to the AlarmID $AlarmId if you want to.
- Though the eG manager executes a command line by default, you can change this Command specification to execute a batch file/script file/executable instead.
- The Command Arguments specification can include any special character that will work from the Windows command prompt or Unix shell, except the # (hash) character, which is used as a separator between the command and the arguments.
- On Windows, the eG manager runs as a service, and hence, has access to all the sysem-defined environment variables. You can use these variables as required in the script that is invoked by the Command specification.
Given below is the list of parameters the default Command arguments display takes, and a brief description of each parameter:
- AlarmId $AlarmId – unique identifier of the alarm
- -DATE $DATE – the date on which the problem occurred
- -TIME $TIME – the time at which the problem occurred.
-
-Priority $Priority – the problem priority - whether Critical, Major, Minor, Normal
- -ComponentType $ComponentType – The problem component type
- -ComponentName $ComponentName – The problem component name
- -Layer $Layer – the protocol layer to which the problem relates.
- -Desc $Desc – a brief description of the problem. This will include a pipe (|) separated list of the following fields – the site name (if relevant to the test), test name, the alarm string (a textual description of the problem), and measurement host. The description is not applicable if the alarm severity is Normal.
- –Service(s) $Service – If more than one service is impacted, this will include a comma-separated list of services.
-
-DD $DD - This parameter is not available by default. If required, you can configure this parameter additionally for the command so that, the output includes detailed diagnosis information. In the output, $DD will be represented in the following format:
“DDcolumn1 DDcolumn2 DDcolumn… ~#~DDdata1~!~DDdata2~!~DDdata3~!~...”
In the eG user interface, the detailed diagnosis pertaining to a single test/measure/descriptor combination is typically presented in a tabular format, with rows and columns. Accordingly, in the command output for a specific test-measure-descriptor combination, the variables DDcolum1, DDcolumn2, etc., will be substituted by the names of the columns in the detailed diagnosis, and the variables DDdata, DDdata2, etc., will report the values that correspond to each column.
Note:
- The detailed diagnosis information reported in the CLI output will typically be the DD information available in the eG database, at the time of command execution by the eG manager.
- A single alarm could have multiple tests, measures, and descriptors associated with it. For each test-measure-descriptor combination, there will be a corresponding DD entry in the command output line (subject to the length restriction discussed in the Limitations section below). The DD output for a single test-measure-descriptor combination will include the column names and data. In the output, these columns and their corresponding data will be separated using the separator ~#~. If a specific combination does not have DD configured or there is no DD reported for that descriptor, a value “-“ will be reported.
- The DD output for each test-measure-descriptor combination will be separated using #~#.
- Detailed diagnosis information for a test-measure-descriptor combination could include rows of data. In the command output, the separator !~! is used to separate multiple rows of DD data.
-
Each row of data in the DD would report values for several columns. The values that correspond to each column will be separated using ~!~ in the DD output.
AlarmId “192.168.10.133_1264839507765” -DATE “Jan 30, 2010” -TIME “13:48:24” -Priority “1” -ComponentType “Host system” -ComponentName “win: NULL” -Layer “Operating System” -Desc “-|SystemDetails|High CPU utilization{Processor_0}|win,-|SystemDetails|Free memory is low{Processor_0}|win” -Service “-“ -DD “ PID %CPU ARGS ~#~692~!~1.60~!~csrss!~!760~!~0.53~!~services!~!6960.53~!~ js #~# PID %MEM ARGS~#~4032~!~7.83~!~tomcat!~!2112~!~6.33~!~firefox!~!3472~!~5.52~!~dbvis”
According to the above output, the following alarm information will be sent to the third-party TT system:
A sample standard output of the default Command specification is given below:
Qualifier
Variable
AlarmId
192.168.10.133_1256878963888
DATE
30/10/2009
TIME
10:32:43
Priority
Critical
ComponentType
Generic
ComponentName
gen133:NULL
Layer
Application Processes
Desc
In our example, the command line output clubs the information pertaining to two alarms related to a single test. The description of the first alarm indicates the following:
- the site affected (if applicable) : In the case of our example, no web site has been impacted by the Critical problem; therefore, only a ‘-’ (hyphen) is displayed instead in the output line.
- The test that reported the problem: In the case of our example, this is SystemDetails test
- The alarm description: In the case of the sample output, this is - High CPU utilization { Processor_0}
- The measurement host: In the case of the sample output, this is – win
The description of the second alarm includes the following:
- the site affected (if applicable) : In the case of the second alarm also, no web site has been impacted by the Critical problem; therefore, only a ‘-’ (hyphen) is displayed instead in the output line.
- The test that reported the problem: In the case of our example, this is SystemDetails test
- The alarm description: In the case of the sample output, this is - Free memory is low{Processor_0}
- The measurement host: In the case of the sample output, this is – win
Service
Since no service has been impacted by the problem at hand, only a ‘-’ is displayed here instead
DD
The sample output above includes the DD information pertaining to two test-measure-descriptor combinations.
For the first test-measure-descriptor combination - i.e., for the CPU utilization measure of the descriptor Processor_0 reported by the SystemDetails test - the DD output includes the following:
- The columns in the DD are as follows: PID, %CPU, and ARGS (as in ‘arguments’).
- The DD for this test-measure-combination includes three rows of data. In the first row of data, the following values will be reported:
- 692 as the PID
- 1.60 as the CPU%
- csrss as the ARGS
- In the second row of data, the following values will be reported:
- 760 as the PID
- 0.53 as the CPU%
- services as the ARGS
- In the third row of data, the following values will be reported:
- 696 as the PID
- 0.53 as the CPU%
- js as the ARGS
For the second test-measure-descriptor combination - i.e., for the Free memory measure of the descriptor Processor_0 reported by the SystemDetails test - the DD output includes the following:
- The columns in the DD are as follows: PID, %MEM, and ARGS (as in ‘arguments’).
-
The DD for this test-measure-combination includes three rows of data. In the first row of data, the following values will be reported:
- 4032 as the PID
- 7.83 as the MEM%
- tomcat as the ARGS
-
In the second row of data, the following values will be reported:
- 2112 as the PID
- 6.33 as the MEM%
- firefox as the ARGS
-
In the third row of data, the following values will be reported:
- 3472 as the PID
- 5.52 as the MEM%
- dbvis as the ARGS
Note:
- DD information will be formatted for better display in eG user interface. From the CLI however, no such special formatting can be effected on the DD output.
- If an alert is raised on multiple descriptors, hyphen (-) will be provided if DD is not available for a specific descriptor.
- Detailed diagnosis could have special characters (e.g., double quotes) that may require special handling when passed to a CLI.
- If the command line execution fails when including DD, CLI will resume execution by excluding the DD, so that the alert does not get lost.
- From the Date format to be used list box, select the format in which the date/time of the problem should be reported in the command output.
- Specify the maximum permissible length of the command in the Command length text box. By default, the command line can have a maximum of 8191 characters. You can alter this default setting by specifying a length of your choice in the Command length text box. If the actual command length exceeds the specified limit, then the output will not return the list of affected services and the detailed diagnosis information; instead, an empty string will appear next to the –Services qualifier. If the command length continues to exceed the specified limit even after truncating the services list and the DD, the command execution will return an error.
- Specify the length of the problem description in the Problem description length text box. If the actual problem description exceeds the specified length, the characters that fall beyond the specified limit will be truncated.
- Finally, click on the Update button to save the changes.
As described above, the eG manager offers a high degree of flexibility in the configuration of the command that should be executed. The periodicity at which the eG manager checks alarms and determines what information it should send to a TT system is determined by the setting of the MailCheckPeriod attribute in the [MISC_ARGS] section of the eg_services.ini file (in the <EG_INSTALL_DIR>\manager\config directory). By default, this value is 180 seconds (3 minutes).