JVM HotSpot Error Log Test
A crash, or fatal error, causes a process to terminate abnormally. There are various possible reasons for a crash. For example, a crash can occur due to a bug in the HotSpot VM, in a system library, in a Java SE library or API, in application native code, or even in the operating system. External factors, such as resource exhaustion in the operating system can also cause a crash.
In some environments, applications for e.g., eG manager, Java Applications, Tomcat etc. that run under the Java HotSpot(tm) Runtime Environment may experience sudden crash. Administrators need to detect such crashes at the earliest in order to avoid the malfunctioning of the rest of the applications in their environment. In most cases, when the applications that run under the Java HotSpot(tm) Runtime Environment crashes or experiences issues, a hs_err_pid.log file is created in the working directory of the application process. For example, in the case of an eG manager, this file is created in the <eG_INSTALL_DIR>/lib or /opt/egurkha/lib folders. By closely keeping a track on the hs_err_pid.log files created in the target application server, administrators can proactively identify any unexpected crash and fix them at the earliest. For this purpose, eG Enterprise offers the JVM HotSpot Error Log Test.
Using this test, administrators can figure out the number of HotSpot error log files that were created in the target application server .
Target of the test : The eG Manager
Agent deploying the test : An internal/remote agent
Outputs of the test : One set of results for the eG manager being monitored.
| Parameter | Description |
|---|---|
|
Test period |
How often should the test be executed . |
|
Host |
The host for which the test is to be configured. |
|
Port |
The port number at which the specified host listens. |
|
Hs Err PID Files Location |
By default, this test tracks the count of hs_err_pid.log files created in the working directory of the target application process. For example, in the case of an eG manager, this file is created by default, in the <eG_INSTALL_DIR>/lib or /opt/egurkha/lib folders as the case may be with Windows or Unix installation of the eG manager. To this effect, none is specified against this text box. If you have directed the hs_err_pid.log file to be written to a location other than the default location, specify the full path to the folder in which the hs_err_pid.log file is written in this text box. For example, if the hs_err_pid.log files are written in ProgramFiles folder, then, your specification can be: C:/ProgramFiles. |
|
DD Frequency |
Refers to the frequency with which detailed diagnosis measures are to be generated for this test. The default is 1:1. This indicates that, by default, detailed measures will be generated every time this test runs, and also every time the test detects a problem. You can modify this frequency, if you so desire. Also, if you intend to disable the detailed diagnosis capability for this test, you can do so by specifying none against DD frequency. |
|
Detailed Diagnosis |
To make diagnosis more efficient and accurate, the eG Enterprise embeds an optional detailed diagnostic capability. With this capability, the eG agents can be configured to run detailed, more elaborate tests as and when specific problems are detected. To enable the detailed diagnosis capability of this test for a particular server, choose the On option. To disable the capability, click on the Off option. The option to selectively enable/disable the detailed diagnosis capability will be available only if the following conditions are fulfilled:
|
| Measurement | Description | Measurement Unit | Interpretation |
|---|---|---|---|
|
Hotspot error log files |
Indicates the number of HotSpot error log files that were newly created during the last measurement period. |
Number |
A sudden/gradual increase in the value of this measure indicates that the Application that is Java HotSpot(tm) Runtime Environment is experiencing frequent crashes. The detailed diagnosis of this measure helps administrators identify the name of the files that were created, the time at which the files were created and the reason of the crash captured by the files. Administrators are further provided with information on the exact command that caused the application server to crash upon execution and the stack trace of the JVM. |
The detailed diagnosis of the Hotspot error log files measure lists the name of the file, time at the file was created, the reason of crash recorded in the log file, the command execution that caused the application server to crash and the stack trace. This information helps administrators initiate troubleshooting much before the end users complain.
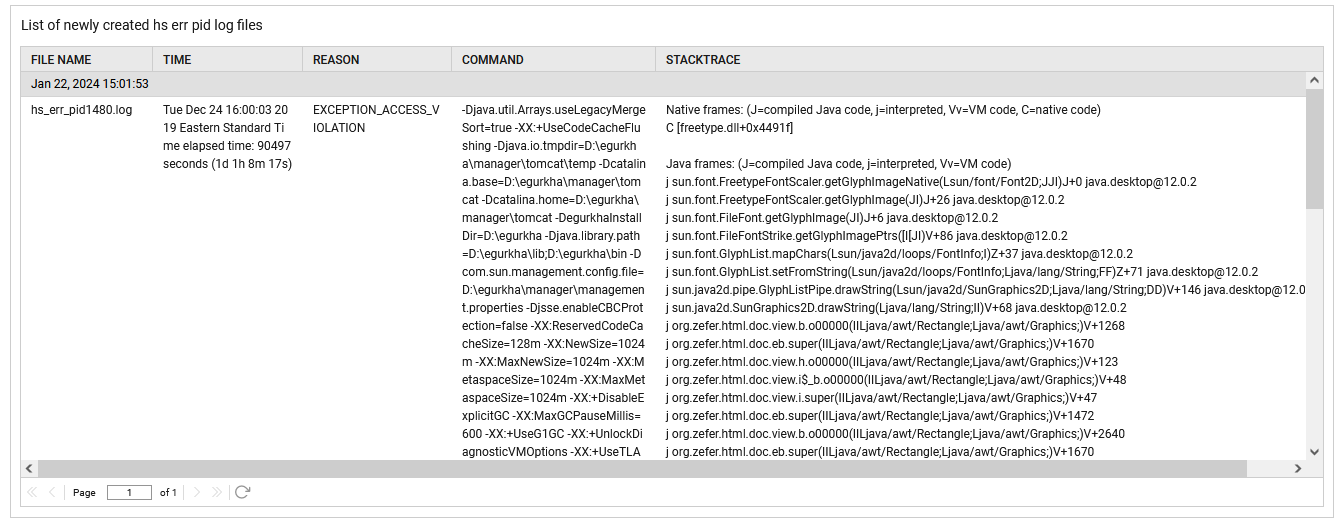
Figure 1 : The detailed diagnosis of the Hotspot error log files measure