
Threshold manager process Test
The Threshold manager process computes the thresholds - i.e., the upper/limits of performance - for every measure collected by the eG agent and stores the thresholds so computed in the eG database. Since thresholds govern the state of a measure, if the threshold manager process fails to compute thresholds or computes them slowly or fails to even run, it can grossly impair the eG monitoring solution's ability to promptly detect problem areas. Using this test, you can understand how efficient the threshold manager process is. The test reports the current status of this process, points you to threshold computation failures and where they occurred, and reveals slowdowns in threshold computation (if any).
Target of the test : The eG Manager
Agent deploying the test : An internal/remote agent
Outputs of the test : One set of results for the eG manager being monitored.
| Parameter | Description |
|---|---|
|
Test period |
How often should the test be executed . |
|
Host |
The host for which the test is to be configured. |
|
Port |
The port number at which the specified host listens. |
|
JMX Remote Port |
Here, specify the port at which the JMX listens for requests from remote hosts. In the <EG_MANAGER_INSTALL_DIR>\manager directory (on Windows; on Unix, this will be the /opt/egurkha/manager directory) of the eG manager, you will find a management.properties file. Set the port defined against the com.sun.management.jmxremote.port parameter of the file as the JMX Remote Port. |
|
User, Password, and Confirm Password |
By default, JMX requires no authentication or security. Therefore, the User, Password , and Confirm Password parameters are set to none by default. |
|
JNDIName |
The JNDIName is a lookup name for connecting to the JMX connector. By default, this is jmxrmi. If you have registered the JMX connector in the RMI registry using a different lookup name, then you can change this default value to reflect the same. |
|
JMX Provider |
This test uses a JMX Provider to access the MBean attributes of the eG manager and collect metrics. Specify the package name of this JMX Provider here. By default, this is set to com.sun.jmx.remote.protocol. |
|
Timeout |
Specify the duration (in seconds) for which this test should wait for a response from the eG manager. If there is no response from the eG manager beyond the configured duration, the test will timeout. By default, this is set to 240 seconds. |
|
Threshold Duration of Test |
This test reports a Successful threshold tests measure, which indicates the number of tests for which the threshold manager successfully computed thresholds. The detailed diagnosis of this measure, if enabled, will by default list only the top-10 successful threshold tests, arranged in the descending order of the time taken by the threshold manager to compute thresholds on them. To arrive at this top-10 list, the test considers only those successful tests for which the threshold manager took more than 1 minute (by default) for threshold computation. This is why, the Threshold Duration of Test parameter is set to 1 (minute) by default. This default setting can be overridden by specifying a duration (in minutes) of your choice in the Threshold Duration of Test text box. For instance, if you specify 5 here, then, the detailed diagnosis will list the top-10 (by default) successful threshold tests for which the threshold manager took more than 5 minutes for threshold computation. |
|
Top Time Taken Test |
As already mentioned, the detailed diagnosis of the Successful threshold tests measure, by default, lists the top-10 successful threshold tests, arranged in the descending order of the time taken by the threshold manager to compute thresholds on them. This is why, the top time taken test is set to 10 by default. To view more or a less number of successful threshold tests in the detailed diagnosis, specify a different value in the Top Time Taken Test text box. For instance, if 20 is specified here, then the detailed diagnosis will list the top-20 successful threshold tests. |
|
Detailed Diagnosis |
To make diagnosis more efficient and accurate, the eG Enterprise embeds an optional detailed diagnostic capability. With this capability, the eG agents can be configured to run detailed, more elaborate tests as and when specific problems are detected. To enable the detailed diagnosis capability of this test for a particular server, choose the On option. To disable the capability, click on the Off option. The option to selectively enable/disable the detailed diagnosis capability will be available only if the following conditions are fulfilled:
|
| Measurement | Description | Measurement Unit | Interpretation | ||||||||
|---|---|---|---|---|---|---|---|---|---|---|---|
|
Thresholding status |
Indicates the current status of the threshold manager process. |
|
The values that this measure reports and the numeric values that correspond to them have been discussed in the table below:
Note: By default, this measure reports the Measure Values listed in the table above to indicate the current status of the threshold manager process. The graph of this measure however, represents the same using the numeric equivalents only. |
||||||||
|
Time taken for thresholding |
Indicates the total time taken by the threshold manager to compute thresholds.
|
Minutes |
Ideally, the value of this measure should be low. A steady rise in this measure value is a cause for concern, as it indicates that the threshold manager is taking too long to compute thresholds. This can happen if the threshold manager needs to compute thresholds for too many tests, measures, and descriptors. |
||||||||
|
Successful threshold tests |
Indicates the number of tests for which thresholds were computed successfully. |
Number |
You can use the detailed diagnosis of this measure to know the tests for which thresholds have been successfully computed. |
||||||||
|
|
Failed threshold tests: Indicates the number of tests for which threshold computation failed. |
Number |
The value 0 is desired for this measure. Any non-zero value is indicative of a thresholding failure. In this case, you can use the detailed diagnosis of this measure to identify those tests for which threshold computation failed and investigate the reason why. Without thresholds, the monitoring solution cannot detect problem conditions; nor can it compute state. |
||||||||
|
Time since last completion |
Indicates the elapsed time since the last threshold computation. |
Minutes |
Typically, thresholding is scheduled to take place at the end of every day. By carefully observing the values reported by this measure, you can easily find out when a scheduled threshold computation cycle was missed. |
||||||||
|
Is threshold running as a separate process?
|
Indicates whether/not the threshold manager is running as a separate process.
|
|
The eG manager runs as a Java process. The maximum heap memory that can be allocated to a 32-bit eG manager process is limited to 1.5 GB. The maximum heap memory allocation to a 64-bit eG manager process on the other hand, is limited to 3 GB. Even if the physical Even if the physical server on which the eG manager is installed has more memory, since it is a single Java process, the eG manager cannot exploit the additional memory available on the server. To overcome this limitation, in eG Enterprise, the critical eG manager functions such as email alert management, threshold computation, trending, and database cleanup activities can all be run as separate Java processes (i.e., in addition to the core eG manager process). Removing these key functions from the core eG manager process makes additional memory available for the core eG manager functions including data reception and analysis, alarm correlation, and web-based access and reporting. This reconfiguration of the eG manager into separate Java processes allows the eG manager to make better utilization of available server hardware resources and thereby offers enhanced scalability. In turn, this allows customers to get more leverage from their existing investment in the hardware that hosts the eG manager. If cleanup has been configured to run as a separate Java process, then the value of this measure will be Yes. If not, then this measure reports the value No. The numeric values that correspond to the measure values above are as follows:
Note: By default, this measure reports the Measure Values listed in the table above to indicate whether/not cleanup runs as a separate Java process. The graph of this measure however, represents the same using the numeric equivalents only. |
||||||||
|
Slow threshold tests |
Indicates the number of tests for which threshold computation was slow. |
Number |
Use the detailed diagnosis of this measure to know for which tests threshold computation was slow. |
The detailed diagnosis of the Failed threshold tests measure lists all the tests on which threshold computation failed and briefly describes the reason for the failure.
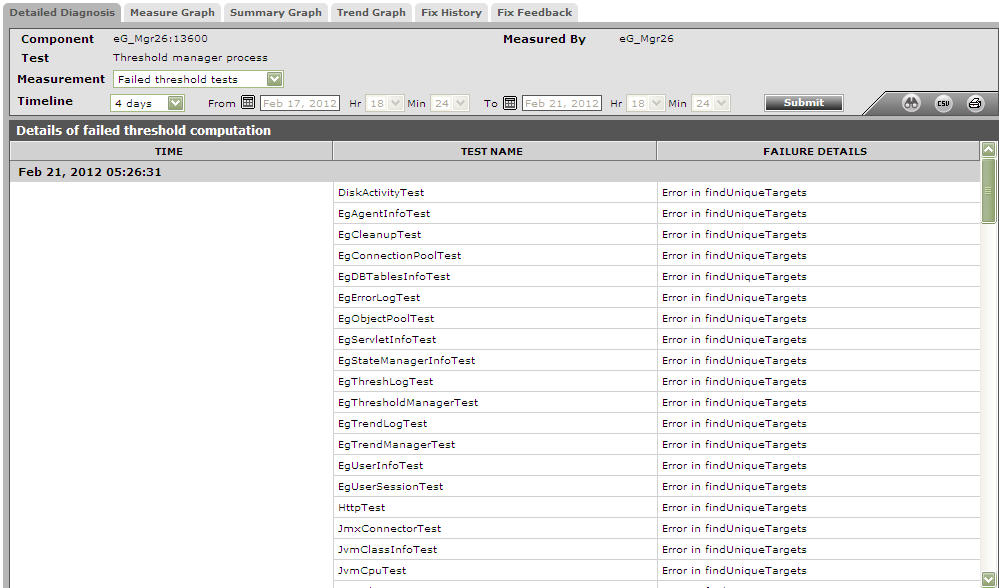
Figure 1 : The detailed diagnosis of the Failed threshold tests measure
